In Statistics, a cumulative frequency is defined as the total of frequencies, that are distributed over different class intervals. It means that the data and the total are represented in the form of a table in which the frequencies are distributed according to the class interval. In this article, we are going to discuss in detail the cumulative frequency distribution, types of cumulative frequencies, and the construction of the cumulative frequency distribution table with examples in detail.
What is Meant by Cumulative Frequency Distribution?
The cumulative frequency is the total of frequencies, in which the frequency of the first class interval is added to the frequency of the second class interval and then the sum is added to the frequency of the third class interval and so on. Hence, the table that represents the cumulative frequencies that are divided over different classes is called the cumulative frequency table or cumulative frequency distribution. Generally, the cumulative frequency distribution is used to identify the number of observations that lie above or below the particular frequency in the provided data set.
Types of Cumulative Frequency Distribution
The cumulative frequency distribution is classified into two different types namely: less than ogive or cumulative frequency and more/greater than cumulative frequency.
Less Than Cumulative Frequency:
The Less than cumulative frequency distribution is obtained by adding successively the frequencies of all the previous classes along with the class against which it is written. In this type, the cumulate begins from the lowest to the highest size.
Greater Than Cumulative Frequency:
The greater than cumulative frequency is also known as the more than type cumulative frequency. Here, the greater than cumulative frequency distribution is obtained by determining the cumulative total frequencies starting from the highest class to the lowest class.
Graphical Representation of Less Than and More Than Cumulative Frequency
Representation of cumulative frequency graphically is easy and convenient as compared to representing it using a table, bar-graph, frequency polygon etc.
The cumulative frequency graph can be plotted in two ways:
- Cumulative frequency distribution curve(or ogive) of less than type
- Cumulative frequency distribution curve(or ogive) of more than type
Steps to Construct Less than Cumulative Frequency Curve
The steps to construct the less than cumulative frequency curve are as follows:
- Mark the upper limit on the horizontal axis or x-axis.
- Mark the cumulative frequency on the vertical axis or y-axis.
- Plot the points (x, y) in the coordinate plane where x represents the upper limit value and y represents the cumulative frequency.
- Finally, join the points and draw the smooth curve.
- The curve so obtained gives a cumulative frequency distribution graph of less than type.
To draw a cumulative frequency distribution graph of less than type, consider the following cumulative frequency distribution table which gives the number of participants in any level of essay writing competition according to their age:
Table 1 Cumulative Frequency distribution table of less than type
| Level of Essay | Age Group
(class interval) |
Age group | Number of participants
(Frequency) |
Cumulative Frequency |
| Level 1 | 10-15 | Less than 15 | 20 | 20 |
| Level 2 | 15-20 | Less than 20 | 32 | 52 |
| Level 3 | 20-25 | Less than 25 | 18 | 70 |
| Level 4 | 25-30 | Less than 30 | 30 | 100 |
On plotting corresponding points according to table 1, we have

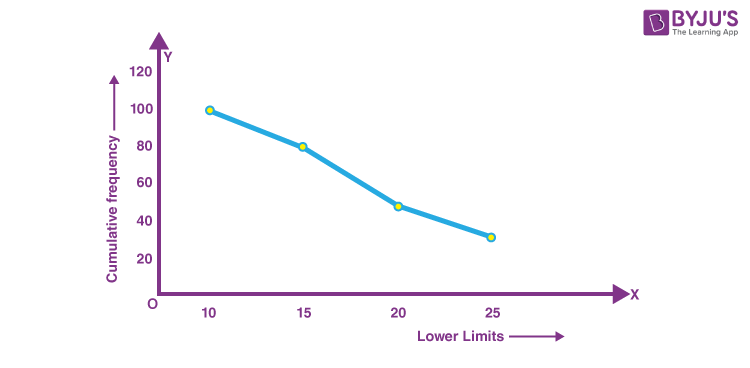
Steps to Construct Greater than Cumulative Frequency Curve
The steps to construct the more than/greater than cumulative frequency curve are as follows:
- Mark the lower limit on the horizontal axis.
- Mark the cumulative frequency on the vertical axis.
- Plot the points (x, y) in the coordinate plane where x represents the lower limit value, and y represents the cumulative frequency.
- Finally, draw the smooth curve by joining the points.
- The curve so obtained gives the cumulative frequency distribution graph of more than type.
To draw a cumulative frequency distribution graph of more than type, consider the same cumulative frequency distribution table, which gives the number of participants in any level of essay writing competition according to their age:
Table 2 Cumulative Frequency distribution table of more than type
| Level of Essay | Age Group
(class interval) |
Age group | Number of participants
(Frequency) |
Cumulative Frequency |
| Level 1 | 10-30 | More than 10 | 20 | 100 |
| Level 2 | 15-30 | More than 15 | 32 | 80 |
| Level 3 | 20-30 | More than 20 | 18 | 48 |
| Level 4 | 25-30 | More than 25 | 30 | 30 |
On plotting these points, we get a curve as shown in the graph 2.
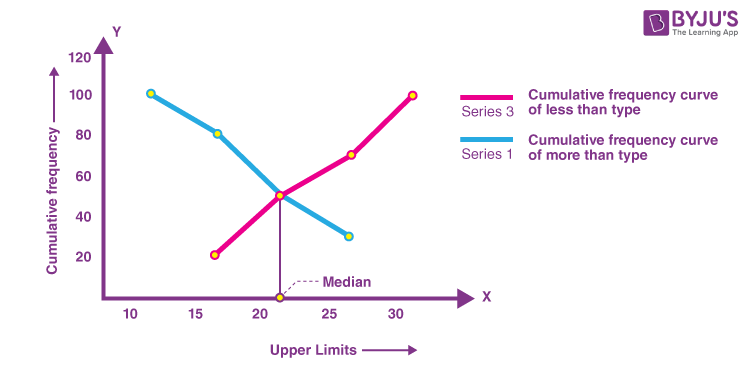
These graphs are helpful in figuring out the median of a given data set. The median can be found by drawing both types of cumulative frequency distribution curves on the same graph. The value of the point of intersection of both the curves gives the median of the given set of data. For the given table 1, the median can be calculated as shown:
Example on Cumulative Frequency
Example:
Create a cumulative frequency table for the following information, which represent the number of hours per week that Arjun plays indoor games:
Arjun’s game time:
| Days | No. of Hours |
| Monday | 2 hrs |
| Tuesday | 1 hr |
| Wednesday | 2 hrs |
| Thursday | 3 hrs |
| Friday | 4 hrs |
| Saturday | 2 hrs |
| Sunday | 6 hrs |
Solution:
Let the no. of hours be the frequency.
Hence, the cumulative frequency table is calculated as follows:
| Days | No. of Hours (Frequency) | Cumulative Frequency |
| Monday | 2 hrs | 2 |
| Tuesday | 1 hr | 2+1 = 3 |
| Wednesday | 2 hrs | 3+2 = 5 |
| Thursday | 3 hrs | 5+3 = 8 |
| Friday | 4 hrs | 8+4 = 12 |
| Saturday | 2 hrs | 12+2 = 14 |
| Sunday | 6 hrs | 14+6 = 20 |
Therefore, Arjun spends 20 hours in a week to play indoor games.
Thus using statistics we can tackle many real-life problems. To know more about statistics, download BYJU’S-The Learning App from Google Play Store.
Frequently Asked Questions on Cumulative Frequency Distribution
What is meant by cumulative frequency?
The cumulative frequency (c.f) is defined as the total of frequencies, where the frequency of the first class interval is added to the frequency of the second class interval and then the sum is added to the frequency of the third class interval and so on.
What is meant by cumulative frequency distribution?
A table that shows the cumulative frequencies, which are distributed over different classes is known as the cumulative frequency table or cumulative frequency distribution.
What are the two types of cumulative frequencies?
The two types of cumulative frequencies are less than cumulative frequency and more than cumulative frequency.
What is meant by cumulative frequency series?
The series of frequencies that are added continuously corresponding to each class interval is known as the cumulative frequency series.
How to calculate the cumulative frequency?
The cumulative frequency can be calculated by adding the frequency of the first class interval to the frequency of the second class interval. After that, the sum is added to the frequency of the third class interval, etc.

I like this website and byjus too.