A parabola graph depicts a U-shaped curve drawn for a quadratic function. In Mathematics, a parabola is one of the conic sections, which is formed by the intersection of a right circular cone by a plane surface. It is a symmetrical plane U-shaped curve. A parabola graph whose equation is in the form of f(x) = ax2+bx+c is the standard form of a parabola. The vertex of a parabola is the extreme point in it whereas the vertical line passing through the vertex is the axis of symmetry.
To draw a parabola graph, we have to first find the vertex for the given equation. This can be done by using x=-b/2a and y = f(-b/2a). Plotting the graph, when the quadratic equation is given in the form of f(x) = a(x-h)2 + k, where (h, k) is the vertex of the parabola, is its vertex form. Find all the parabola formulas for vertex, focus and directrix here. In this article, we are going to learn how to graph a parabola in the standard form as well as in the vertex form with many solved examples. Before plotting the parabola graph in the standard form and in vertex form, let us go through these two different forms in detail.
| Table of Contents: |
What is Parabola Graph?
A parabola is a U-shaped curve that is drawn for a quadratic function, f(x) = ax2 + bx + c. The graph of the parabola is downward (or opens down), when the value of a is less than 0, a < 0. The graph of parabola is upward (or opens up) when the value of a is more than 0, a > 0. Hence, the direction of parabola is determined by sign of coefficient ‘a’.
Vertex
The vertex of parabola will represent the maximum and minimum point of parabola.
Axis of Symmetry
The axis of symmetry of parabola always passes through its vertex and is parallel to y-axis.
y-intercept
The point at which the parabola graph passes through the y-axis is called y-intercept. The parabola of quadratic function passes through an only a single point at the y-axis,
x-intercepts
The points at which the parabola graph passes through the x-axis, are called x-intercepts, which expresses the roots of quadratic function.
Standard Form of Parabola Equation
The equation of parabola can be expressed in two different ways, such as the standard form and the vertex form. The standard form of parabola equation is expressed as follows:
f(x) = y= ax2 + bx + c
The orientation of the parabola graph is determined using the “a” value.
- If the value of a is greater than 0 (a>0), then the parabola graph is oriented towards the upward direction.
- If the value of a is less than 0 (a<0), then the parabola graph opens downwards.
The axis of symmetry from the standard form of the parabola equation is given as x= -b/2a.
Vertex Form of Parabola Equation
The extreme point of a parabola, whether it is maximum or minimum, is called vertex of parabola. The parabola equation can also be represented using the vertex form. The vertex form of the parabola equation is represented by:
f(x) = y = a (x-h)2+k
Here, (h, k) is the vertex point of the parabola.
Similar to the standard form of the parabola equation, the orientation of the parabola in the vertex form is determined by the parameter “a”.
(i.e) If the value of “a” is positive, the parabola graph is upwards.
If the value of “a” is negative, the parabola graph is downwards.
How to Graph Parabola?
Two points define a line. Since parabola is a curve-shaped structure, we have to find more than two points here, to plot it. We need to determine at least five points as a medium to design a pleasing shape. In the beginning, we draw a parabola by plotting the points.
Suppose we have a quadratic equation of the form y=ax2+ bx + c, where x is the independent variable and y is the dependent variable. We have to choose some values for x and then find the corresponding y-values. Now, these values of x and y values will provide us with the points in the x-y plane to plot the required parabola. With the help of these points, we can sketch the graph.
In case, if the parabola equation is provided in the vertex form, first check the value of a. If the value of a is positive, then the parabola graph is upwards, otherwise, it is negative. Next, determine the vertex point (h, k) from the given equation. Then, we have to substitute some value of x and find the corresponding values of y. Finally, plot all the values in the graph to obtain a parabola.
Related Articles
Let us understand with the help of examples.
Graphing Parabola Solved Examples
Example 1:
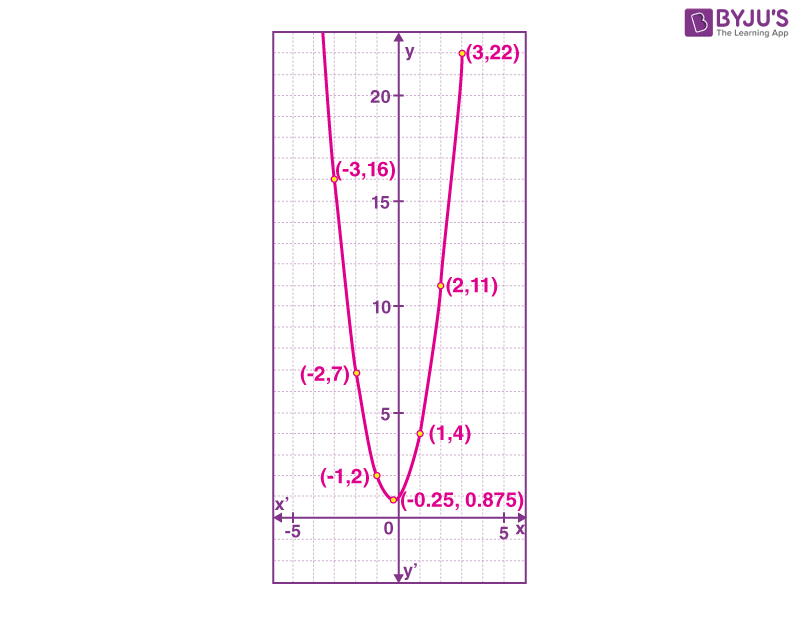
Draw a graph for the equation y = 2x2 + x+ 1.
Solution:
The given equation is y = 2x2 + x+ 1.
Here, a = 2, b = 1 and c = 1.
It needs to find the vertex now
x = -b/(2a)
x = -1/(2(2))
x = -1/ 4
x = -0.25
Now putting x = -0.25 in the equation y= 2x2 + x+ 1
y= 2(-0.25)2 + (-0.25)+ 1.
y = 2(0.0625) – 0.25+1
y = 0.125 – 0.25 +1
y = 0.875
Now putting the different values for x and calculate the corresponding values for y.
- When x = 1 ⇒ y= 2x2 + x+ 1 ⇒ y = 2(1)2+ 1 + 1 ⇒ y = 2+ 1 + 1 ⇒ y = 4
- When x = 2 ⇒ y= 2x2 + x+ 1 ⇒ y = 2(2)2+ 2 + 1 ⇒ y = 8+ 2 + 1 ⇒ y = 11
- When x = 3 ⇒ y= 2x2 + x+ 1 ⇒ y = 2(3)2+ 3 + 1 ⇒ y = 18+ 3 + 1 ⇒ y = 22
- When x = -1 ⇒ y= 2x2 + x+ 1 ⇒ y = 2(-1)2– 1 + 1 ⇒ y = 2- 1 + 1 ⇒ y = 2
- When x = -2 ⇒ y= 2x2 + x+ 1 ⇒ y = 2(-2)2– 2 + 1 ⇒ y = 8- 2 + 1 ⇒ y = 7
- When x = -3 ⇒ y= 2x2 + x+ 1 ⇒ y = 2(-3)2– 3 + 1 ⇒ y = 18 -3 + 1 ⇒ y = 16
Hence,
| x | 1 | 2 | 3 | -1 | -2 | -3 |
| y | 4 | 11 | 22 | 2 | 7 | 16 |
Plot all the points and join the plotted points.
Example 2:
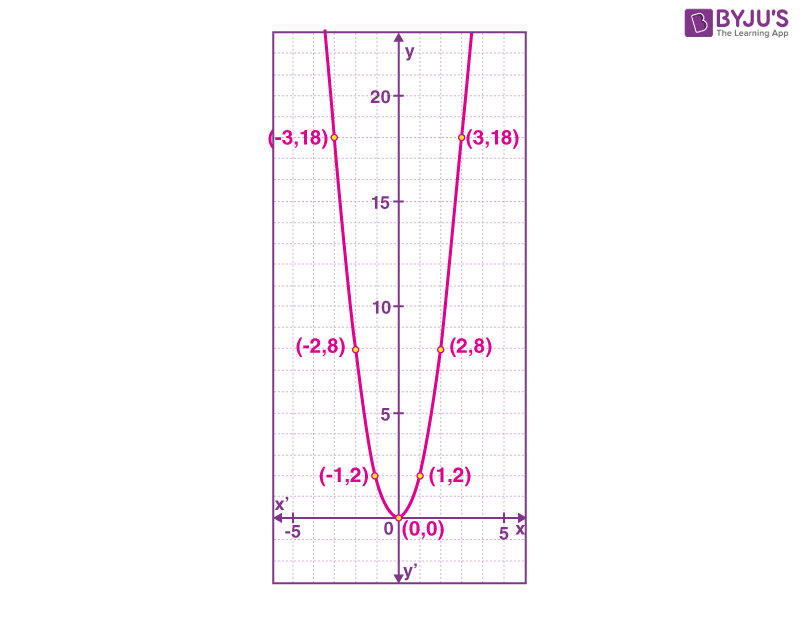
Draw a graph for the equation y = 2x2.
Solution:
The given equation is y= 2x2.
Here a = 2, b = 0 and c = 0.
It needs to find the vertex now
x = -b/(2a)
x = 0
Now putting x = 0 in the equation y= 2x2.
y= 2x2
y = 2(0)2
y = 0
Now putting in different values for x and calculate the corresponding values for y.
- When x = 1 ⇒ y= 2x2⇒ y = 2(1)2 ⇒ y = 2
- When x = 2 ⇒ y= 2x2⇒ y = 2(2)2⇒ y = 8
- When x = 3 ⇒ y= 2x2⇒ y = 2(3)2⇒ y = 18
- When x = -1 ⇒ y= 2x2⇒ y = 2(-1)2⇒ y = 2
- When x = -2 ⇒ y= 2x2⇒ y = 2(-2)2⇒ y = 8
- When x = -3 ⇒ y= 2x2⇒ y = 2(-3)2⇒ y = 18
Hence,
| x | 1 | 2 | 3 | -1 | -2 | -3 |
| y | 2 | 8 | 18 | 2 | 8 | 18 |
Plot all the points and join the plotted points.
Stay tuned with BYJU’S – The Learning App to learn more Maths-related concepts and also get many interactive videos to learn in an easy way.
Frequently Asked Questions on Parabola Graph
What are the two different ways to express the parabola equation?
The parabola equation is expressed in two forms, such as:
Standard Form
Vertex Form
What is the standard form of the parabola equation?
The standard form of the parabola equation is f(x) = y = ax2 + bx + c.
What is the vertex form of the parabola equation?
The vertex form of the parabola equation is f(x) = y = a (x-h)2+k.
Can we determine the orientation of the parabola using the value of “a” in the vertex form?
Yes, we can determine the orientation of the parabola using the value of “a” in vertex form. If “a” is positive, the parabola is oriented upwards, otherwise, it is downwards.
How to determine the axis of symmetry in the standard form of the parabola equation?
The axis of symmetry in the standard form of the parabola equation is determined using the formula, x= -b/2a.


Comments