What is a Phase Diagram?
A phase diagram is a graphical representation of the various phases of a substance or mixture of substances that coexist in thermodynamic equilibrium, and undergo phase changes under different working conditions, such as temperature, pressure, or volume.
The water system is divided into three phases: ICE (S), WATER (L), and WATER VAPOUR (G)
Since H2O is the only chemical compound present, as a result, it is a one-component system.
Table of Contents
- Depiction in Phase Diagram of Water
- Difference between General Phase Diagram and Phase Diagram of Water
- Phase Diagram for Water
- Frequently Asked Questions – FAQs
Depiction in Phase Diagram of Water
At different temperatures and pressures, a phase diagram depicts the preferred physical states of matter. Water is a liquid at typical room temperatures and pressures, but it becomes solid (i.e. ice) if the temperature is reduced below 273 K, and gaseous (i.e. steam) if the temperature is increased above 373 K at the same pressure.
Each line describes the conditions that exist when two phases coexist, but a change in temperature or pressure can cause the phases to abruptly change from one to the other.
When three lines come together, there is a ‘triple point,’ which is where three phases coexist but can abruptly and completely change into each other due to a change in temperature or pressure. Four lines cannot intersect at the same point.
A ‘critical point’ is defined as the point at which the properties of two phases become indistinguishable from one another.
Difference between General Phase Diagram and Phase Diagram for Water
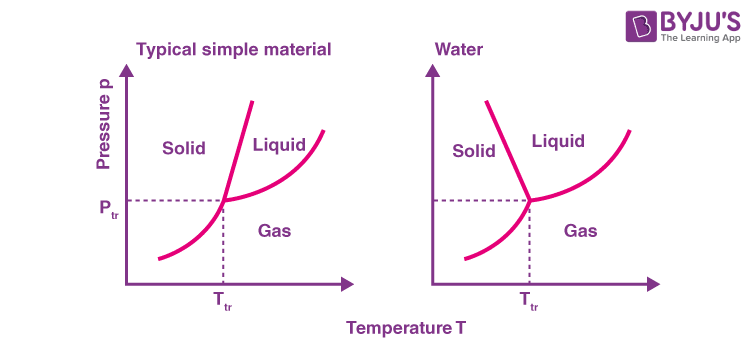
There is one significant difference between the general phase diagram and the water phase diagram. The slope of the line connecting the solid and liquid states in the water diagram is negative rather than positive. Water is an unusual substance in that its solid state is less dense than its liquid state. In liquid water, ice floats. As a result, a change in pressure has the opposite effect on those two phases. When ice is near its melting point, it can be converted into liquid water by applying pressure. In the liquid phase, water molecules are actually closer together than in the solid phase.
Phase Diagram for Water

Curves:
- OA- Water & Vapor
OA is the vaporisation curve. The curve OA comes to an end at A. It has a critical pressure of 218 atm and a temperature of 374℃. It represents the vapour pressure of a liquid at various temperatures.
Along the curve, two phases of water and water vapours coexist in equilibrium.
The vapour pressure is one atmosphere. The corresponding temperature in degrees Celsius is the boiling point of water, which is 100℃.
- OB- Ice and Vapor
The OB curve is a sublimation curve. The curve OB comes to an end at B, which is the absolute zero temperature of -273℃. It depicts the vapour pressure of solid ice at various temperatures.
In equilibrium, the two phases of solid ice and water vapour coexist.
- OC- Ice & Water
The OC curve is the fusion curve. The OC curve comes to an end at C, the critical pressure.
In equilibrium, the two phases of solid ice and liquid water coexist. The curve shows that the melting point of ice decreases as pressure increases. At one atm, the line intersects the curve at 0℃.
Areas:
The area AOC, AOB, and BOC the curves or areas between the curves represent the conditions at temperature and pressure under which a single phase, i.e., ice, water, and water vapour, can exist indefinitely.
- BOC- Ice- denotes the solid phase.
- COA- Water- denotes the liquid phase.
- AOB- Vapour- denotes the gaseous phase
Triple Point:
All three curves, OA, OB, and OC, meet at point O, which is known as the triple point, where all three phases, solid, liquid, and vapour, are in simultaneous equilibrium.
At 0.0075℃ and 4.58 mm Hg pressure, the triple point occurs.
Recommended Videos
Why Is Water Precious?

Frequently Asked Questions on Phase Diagram of Water
What is the difference between the general phase diagram and the phase diagram for water?
The slope of the line connecting the solid and liquid states in the water diagram is negative rather than positive.
Define critical temperature.
A substance’s critical temperature (TC) is the highest temperature at which it can exist as a liquid.
What does the critical point mean in the phase diagram of water?
The critical point is the point at which the critical temperature and pressure meet. Water particles in the gas phase are moving very quickly at 373.99°C. No matter how much pressure is applied to the gas, the gas phase cannot liquefy at any temperature higher than that.
Why does the melting point of ice get lower at higher pressures?
When pressure increases, the melting point of ice decreases because volume decreases, and the volume of water is less than that of ice.
Is it possible to compress steam to form a liquid if the temperature is higher than 374°C?
Water particles in the gas phase are moving very quickly at 373.99°C. No matter how much pressure is applied to the gas, the gas phase cannot liquefy at any temperature higher than that.

Comments