A standard deviation is a useful tool in investing and trading strategies. It is an important topic in statistics. Standard deviation calculates the dispersion of a dataset relative to its mean. If the data points are away from the mean, there is a higher deviation within the data set. Hence, the more spread out the data, the greater the standard deviation. Standard deviation cannot be negative. Mean is the average of a given set of observations. In this article, we will discuss how to find the standard deviation of grouped data.
What is Standard Deviation?
Standard deviation calculates the dispersion of a dataset relative to its mean.
It is denoted by σ.
How to calculate the Standard Deviation of grouped data step by step?
Step 1: Make the frequency distribution table with 6 columns. Write class and frequency fi in the first and second columns, respectively.
Step 2: Find N = ∑ni=1 fi.
Step 3: Find the midpoint of each class. This is denoted by xi. It is the average of the upper-class limit and the lower class limit. Write xi in the 3rd column.
Step 4: Find fixi (product of frequency and mid-point). Write those values in the 4th column.
Step 5: Find x̄ using the formula (1/N) ∑ni=1 fixi.
Step 6: Find (xi – x̄)2 and enter in the 5th column.
Step 7: Find fi(xi – x̄)2 and enter in the 6th column.
Step 8: Find ∑fi(xi – x̄)2.
Step 9: Find standard deviation using the formula:
Formula
If the frequency distribution has n classes each class defined by its mid-point xi with frequency fi, the standard deviation can be calculated by the formula
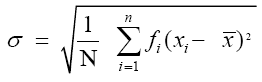
Where N = ∑ni=1 fi.
x̄ is the mean of the distribution.
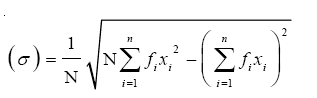
Another formula for standard deviation is given by
Example
The mean and S.D. of the marks of 200 candidates were found to be 40 and 15, respectively. Then, it was discovered that a score of 40 was wrongly read as 50. The correct mean and S.D., respectively, are
(A) 14.98, 39.95
(B) 39.95, 14.98
(C) 39.95, 224.5
(D) None of these
Solution:
Given no. of candidates = 200
mean = 40
S.D = 15
Corrected ∑x = 40 × 200 – 50 + 40 = 7990
Corrected x̄ = 7990/200 = 39.95
Incorrect ∑x2 = n(σ2 + x̄2)
= 200(152 + 402)
= 200(225 + 1600)
= 365000
Correct ∑x2 = 365000 – 2500 + 1600
= 364100
σ = √((364100/200)- 3 9.952)
= √(1820.5 – 1596.0025)
= √224.49
= 14.98
Hence option (B) is the answer.
Click here to practice more problems on Statistics.
Frequently Asked Questions
What do you mean by Standard Deviation?
Standard Deviation is a measure that denotes how much variation from the mean exists. It determines the extent to which the values differ from the average.
Can Standard Deviation be negative?
No. Standard Deviation cannot be negative.
What is the relation between Standard Deviation and Variance?
Standard Deviation is the square root of Variance. Variance is the average of the values of squared differences from the arithmetic mean.

Comments