ML Aggarwal Solutions for Class 9 Maths Chapter 20 Statistics are provided here to help students strengthen their conceptual knowledge on the subject. As we know, Mathematics is one of the high-scoring subjects. Hence, students need adequate practice in solving problems to secure high marks. These solutions help in breaking down all the difficult problems through the simple step-by-step method of solving them. In order to help students score high marks, these solutions are according to the latest ICSE guidelines. Students can access the solutions of this chapter from the ML Aggarwal Solutions for Class 9 Maths Chapter 20 Statistics PDF from the link mentioned below.
The 20th chapter deals with problems pertaining to finding the mean and median of ungrouped and grouped data. Also, the formation and representation of statistical data in various forms are studied in this chapter. For easy accessibility of the ML Aggarwal Solutions, it is made available in PDF format. This will provide guidance to the students while solving problems in the absence of a tutor. In addition, using this valuable resource increases the confidence level of students.
ML Aggarwal Solutions for Class 9 Maths Chapter 20 Statistics


Access ML Aggarwal Solutions for Class 9 Maths Chapter 20 Statistics
Exercise 20.1
1. Find the mean of 8, 6, 10, 12, 1, 3, 4, 4.
Solution:
Given data,
8, 6, 10, 12, 1, 3, 4, 4
Here, n = 8
∴ Mean (x̄)
Ʃ xi/ n = (8 + 6 + 10 + 12 + 1+ 3 + 4 + 4)/8
= 48/8 = 6
Therefore, mean of the given data is 6.
2. 5 people were asked about the time in a week they spend in doing social work in their community. They replied 10, 7, 13, 20 and 15 hours, respectively. Find the mean time in a week devoted by them for social work.
Solution:
Given data,
10, 7, 13, 20, 15
Here, n = 5
∴ Mean (x̄)
Ʃ xi/ n = (10 + 7 + 13 + 20 + 15)/5
= 65/5 = 13
Therefore, the mean time in a week devoted by them for social work is 13 hours.
3. The enrollment of a school during six consecutive years was as follows:
1620, 2060, 2540, 3250, 3500, 3710.
Find the mean enrollment.
Solution:
Given data,
1620, 2060, 2540, 3250, 3500, 3710
Here, n = 6
∴ Mean (x̄)
Ʃ xi/ n = (1620 + 2060 + 2540 + 3250 + 3500 + 3710)/5
= 16680/6 = 2780
Therefore, the mean enrollment is 2780.
4. Find the mean of the first twelve natural numbers.
Solution:
The first twelve natural numbers are: 1, 2, 3, 4, 5, 6, 7, 8, 9, 10, 11, 12
Here, n = 12
∴ Mean (x̄)
Ʃ xi/ n = (1 + 2 + 3 + 4 + 5 + 6 + 7 + 8 + 9 + 10 + 11 + 12)/12
= 78/12 = 6.5
Therefore, the mean of the first twelve natural numbers is 6.5
5. (i) Find the mean of the first six prime numbers.
(ii) Find the mean of the first seven odd prime numbers.
Solution:
(i) First 6 prime numbers are 2, 3, 5, 7, 11, 13
Here, n = 6
∴ Mean (x̄)
Ʃ xi/ n = (2 + 3 + 5 + 7 + 11 + 13)/6
= 41/6
Therefore, the mean of the first six prime numbers is 41/6.
(ii) First seven odd prime numbers are 3, 5, 7, 11, 13, 17, 19
Here, n = 7
∴ Mean (x̄)
Ʃ xi/ n = (3 + 5 + 7 + 11 + 13 + 17 + 19)/7
= 75/7
Therefore, the mean of the first six prime numbers is 75/7.
6. (i)The marks (out of 100) obtained by a group of students in a Mathematics test are 81, 72, 90, 90, 85, 86, 70, 93 and 71. Find the mean marks obtained by the group of students.
(ii) The mean of the age of three students Vijay, Rahul and Rakhi is 15 years. If their ages are in the ratio 4 : 5 : 6 respectively, then find their ages.
Solution:
(i) The marks obtained by the group of students are:
81, 72, 90, 90, 85, 86, 70, 93, 71
Here, n = 9
∴ Mean (x̄)
Ʃ xi/ n = (81 + 72 + 90 + 90 + 85 + 86 + 70 + 93 + 71)/9
= 738/9 = 82
Therefore, the mean marks obtained by the group of students is 82.
(ii) Given, the mean of the age of three students Vijay, Rahul and Rakhi is 15 years.
So, n = 3
Now, the sum of ages of the 3 students = 15 x 3 = 45
Also given, ratio of their ages is 4 : 5 : 6
Sum of ratios = 4 + 5 + 6 = 15
Hence,
Vijay’s age = (45/15) x 4 = 12 years
Rahul’s age = (45/15) x 5 = 15 years
Rakhi’s age = (45/15) x 6 = 18 years
7. The mean of 5 numbers is 20. If one number is excluded, mean of the remaining numbers becomes 23. Find the excluded number.
Solution:
Given,
The mean of 5 numbers = 20
So, the total sum of the numbers = 20 x 5 = 100
After excluding one number,
The mean of the remaining 4 numbers = 23
So, the total sum of these numbers = 23 x 4 = 92
Hence,
The excluded number is = 100 – 92 = 8.
8. The mean of 25 observations is 27. If one observation is included, the mean still remains 27. Find the included observation.
Solution:
Given,
The mean of 25 observations is 27.
So,
The total sum of all the 25 observations = 27 x 25 = 675
After one observation is included,
Now the mean of 26 (25 + 1) numbers = 27
So,
The total sum of all the 26 observations = 27 x 26 = 702
Hence,
The included observation = 702 – 675 = 27
9. The mean of 5 observations is 15. If the mean of first three observations is 14 and that
of the last three is 17, find the third observation.
Solution:
Given,
The mean of 5 observations = 15
So, total sum of the 5 observations = 15 x 5 = 75
Also given,
Mean of first 3 observations = 14
So, the sum of the 3 observations = 14 x 3 = 42
And, the mean of last 3 observations = 17
So, the sum of last 3 observations = 17 x 3 = 51
Thus, the total of 3 + 3 observations = 42 + 51 = 93
Hence,
The third observation = 93 – 75 = 18.
10. The mean of 8 variate is 10.5. If seven of them are 3, 15, 7, 19, 2, 17 and 8, then find
the 8th variate.
Solution:
Given,
Seven out of eight variates are: 3, 15, 7, 19, 2, 17 and 8
Mean of 8 variates = 10.5
So, the total of 8 variates = 10.5 x 8 = 84
Now,
Sum of seven variates = (3 + 15 + 7 + 19 + 2 + 17 + 8) = 71
Hence,
The 8th variate = 84 – 71 = 13.
11. The mean weight of 8 students is 45.5 kg. Two more students having weights 41.7 kg and 53.3 kg join the group. What is the new mean weight?
Solution:
Given,
The mean weight of 8 students = 45.5 kg
So, the total weight of 8 students = 45.5 x 8 = 364 kg
Weight of two more students are 41.7 kg and 53.3 kg
Now,
The total weight of 10 (8 + 2) students = 364 + 41.7 + 53.3
= 364 + 95
= 459 kg
Hence, the new mean weight of all the 10 students = 459/10 = 45.9 kg
12. Mean of 9 observations was found to be 35. Later on, it was detected that an observation 81 was misread as 18. Find the correct mean of the observations.
Solution:
Given,
Mean of 9 observations = 35
So, the sum of all 9 observations = 35 x 9 = 315
Now, the difference due to misread = 81 – 18 = 63
Thus, the actual sum = 315 + 63 = 378
Hence,
The actual mean = 378/ 9 = 42.
13. A student scored the following marks in 11 questions of a question paper:
7, 3, 4, 1, 5, 8, 2, 2, 5, 7, 6.
Find the median marks.
Solution:
Given,
Marks scored in 11 questions of a question paper by the student are:
7, 3, 4, 1, 5, 8, 2, 2, 5, 7, 6
Arranging it in descending order, we have
1, 2, 2, 3, 4, 5, 5, 6, 7, 7, 8
Here, n = 11 which is odd
∴ Median = (n + 1)/2th term
= (11 + 1)/2 = 12/2 = 6th term i.e 5
Hence, the median mark is 5.
14. Calculate the mean and the median of the numbers:
2, 3, 4, 3, 0, 5, 1, 1, 3, 2.
Solution:
First arrange the number in descending order
0, 1, 1, 2, 2, 3, 3, 3, 4, 5
So n = 10 which is even
Mean (x̄) = Ʃ xi/ n
Substituting the values
= (0 + 1 + 1 + 2 + 2 + 3 + 3 + 3 + 4 + 5)/10
By further calculation
= 24/10
= 2.4
Median = ½ [10/2th + (10/2 + 1)th terms]
It can be written as
= ½ (5th + 6th) term
Substituting the values
= ½ (2 + 3)
= 5/2
= 2.5
15. A group of students was given a special test in Mathematics. The test was completed by the various students in the following time in (minutes):
24, 30, 28, 17, 22, 36, 30, 19, 32, 18, 20, 24.
Find the mean time and median time taken by the students to complete the test.
Solution:
First arrange the data in descending order
17, 18, 19, 20, 22, 24, 24, 28, 30, 30, 32, 36
So n = 12 which is even
Mean (x̄) = Ʃ xi/ n
Substituting the values
= (17 + 18 + 19 + 20 + 22 + 24 + 24 + 28 + 30 + 30 + 32 + 36)/2
So we get
= 300/12
= 25
Median = ½ [12/2th + (12/2 + 1)th terms]
It can be written as
= ½ (6th + 7th) terms
Substituting the values
= ½ (24 + 24)
= ½ (48)
= 24
16. In a Science test given to a group of students, the marks scored by them (out of 100) are
41, 39, 52, 48, 54, 62, 46, 52, 40, 96, 42, 40, 98, 60, 52.
Find the mean and median of this data.
Solution:
On arranging the marks obtained by the students, we have
39, 40, 40, 41, 42, 46, 48, 52, 52, 52, 54, 60, 62, 96, 98
Here, n = 15 which is odd
∴ Mean (x̄)
Ʃ xi/ n = (39 + 40 + 40 + 41 + 42 + 46 + 48 + 52 + 52 + 52 + 54 + 60 + 62 + 96 + 98)/15
= 822/15 = 54.8
And,
Median = (15 + 1)/2th term
= 16/2 = 8th term i.e. 52
Therefore, for the given data mean = 54.8 and median = 52.
17. The points scored by a Kabaddi team in a series of matches are as follows:
7, 17, 2, 5, 27, 15, 8, 14, 10, 48, 10, 7, 24, 8, 28, 18.
Find the mean and the median of the points scored by the Kabaddi team.
Solution:
Let’s arrange the given data in descending order:
2, 5, 7, 7, 8, 8, 10, 10, 14, 15, 17, 18, 24, 27, 28, 48
Here, n = 16 when is even
∴ Mean (x̄)
Ʃ xi/ n = (2 + 5 + 7 + 7 + 8 + 8 + 10 + 10 + 14 + 15 + 17 + 18 + 24 + 27 + 28 + 48)/15
= 248/16 = 15.5 points
And,
Median = ½ [(16/2)th term + (16/2 + 1)th term]
= ½ (8th term + 9th term)
= ½ (10 + 14)
= ½ x 24 = 12 points
Therefore, the mean and the median of the points scored by the Kabaddi team are 15.5 and 12 respectively.
18. The following observations have been arranged in ascending order. If the median
the data is 47.5, find the value of x.
17, 21, 23, 29, 39, 40, x, 50, 51, 54, 59, 67, 91, 93.
Solution:
Given data,
17, 21, 23, 29, 39, 40, x, 50, 51, 54, 59, 67, 91, 93
Here, n = 14 which is even
As the given data is arranged in descending order
Median = ½ [(14/2)th term + (14/2 + 1)th term]
= ½ (7th term + 8th term)
⇒ 47.5 = ½ (x + 50)
95 = x + 50
x = 95 – 50 = 45
Hence, the value of x is 45.
19. The following observations have been arranged in ascending order. If the median
the data is 13, find the value of x.
3, 6, 7, 10, x, x + 4, 19, 20, 25, 28.
Solution:
Given observations in ascending order,
3, 6, 7, 10, x, x + 4, 19, 20, 25, 28
Here, n = 10 which is even and median = 13
So,
Median = ½ [(10/2)th term + (10/2 + 1)th term]
= ½ (5th term + 6th term)
= ½ (x + x + 4)
= (2x + 4)/2
= x + 2
⇒ x + 2 = 13
x = 13 – 2 = 11
Hence, the value of x is 11.
Exercise 20.2
1. State which of the following variables are continuous and which are discrete:
(i)marks scored (out of 50) in a test.
(ii) daily temperature of your city.
(iii) sizes of shoes.
(iv)distance travelled by a man.
(v)time.
Solution:
(i) Discrete
(ii) Continuous
(iii) Discrete
(iv) Continuous
(v) Continuous
2. Using class intervals 0 – 4, 5 – 9, 10 – 14, …… construct the frequency distribution for the following data:
13, 6, 10, 5, 11, 14, 2, 8, 15, 16, 9, 13, 17, 11, 19, 5, 7, 12, 20, 21, 18, 1, 8, 12, 18.
Solution:
The frequency distribution for the following data is
| Class | Tally marks | Frequency |
| 0-4 | II | 2 |
| 5-9 | 7 | |
| 10-14 | 8 | |
| 15-19 | 6 | |
| 20-24 | II | 2 |
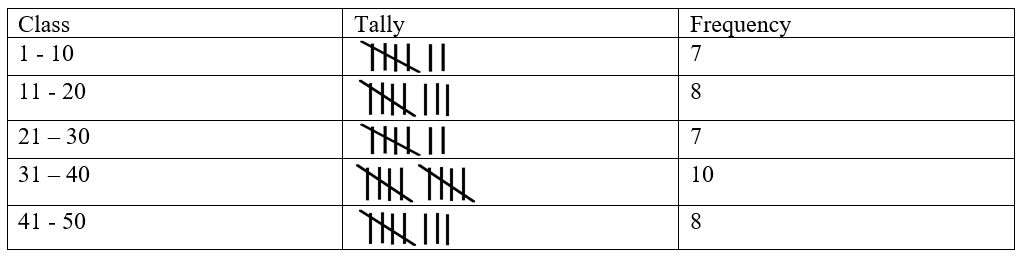
3. Given below are the marks obtained by 27 students in a test:
21, 3, 28, 38, 6, 40, 20, 26, 9, 8, 14, 18, 20, 16, 17, 10, 8, 5, 22, 27, 34, 2, 35, 31, 16, 28, 37.
(i) Using the class intervals 1-10, 11-20 etc. construct a frequency table.
(ii) State the range of these marks.
(iii) State the class mark of the third class of your frequency table.
Solution:
(i) The frequency table of the given data is
| Class | Tally marks | Frequency |
| 1-10 | 7 | |
| 11-20 | 8 | |
| 21-30 | 6 | |
| 31-40 | 6 |
(ii) Range of these marks is 38.
(iii) The class mark of the third class of your frequency table = (21 + 30)/ 2 = 25.5
4. Explain the meaning of the following terms:
(i) variate
(ii) class size
(iii) class mark
(iv) class limits
(v) true class limits
(vi) frequency of a class
(vii) cumulative frequency of a class.
Solution:
(i) Variant: A particular value of a variable is called variate.
(ii) Class size: The difference between the actual upper limit and the actual lower limit of a class is called its class size.
(iii) Class mark: The class mark of a class is the value midway between its actual lower limit and actual upper limit.
(iv) Class limits: In the frequency table the class interval is called class limits.
(v) True class limits: In a continuous distribution, the class limits are called true or actual class limits.
(vi) Frequency of a class: The number of tally marks opposite to a variate is its frequency and it is written in the next column opposite to tally marks of the variate.
(vii) Cumulative frequency of a class: The sum of frequency of all previous classes and that particular class is called the cumulative frequency of the class.
5. Fill in the blanks:
(i) The number of observations in a particular class is called …… of the class.
(ii) The difference between the class marks of two consecutive classes is the ….. of the class.
(iii) The range of the data 16, 19, 23, 13, 11, 25, 18 is …
(iv) The mid-point of the class interval is called its …
(v) The class mark of the class 4 – 9 is ….
Solution:
(i) The number of observations in a particular class is called frequency of the class.
(ii) The difference between the class marks of two consecutive classes is the size of the class.
(iii) The range of the data 16, 19, 23, 13, 11, 25, 18 is 14.
(iv) The mid-point of the class interval is called its class marks.
(v) The class mark of the class 4 – 9 is 6.5. [Class mark = (4 + 9)/2 = 13/2 = 6.5]
6. The marks obtained (out of 50) by 40 students in a test are given below:
28, 31, 45, 03, 05, 18, 35, 46, 49, 17, 10, 28, 31, 36, 40, 44, 47, 13, 19, 25, 24, 31, 38, 32,
27, 19, 25, 28, 48, 15, 18, 31, 37, 46, 06, 01, 20, 10, 45, 02.
(i) Taking class intervals 1- 10, 11 – 20, .., construct a tally chart and a frequency
distribution table.
(ii) Convert the above distribution to continuous distribution.
(iii) State the true class limits of the third class.
(iv) State the class mark of the fourth class.
Solution:
(i) A tally chart and a frequency distribution of given data is
(ii) Converting the above distribution to continuous distribution.
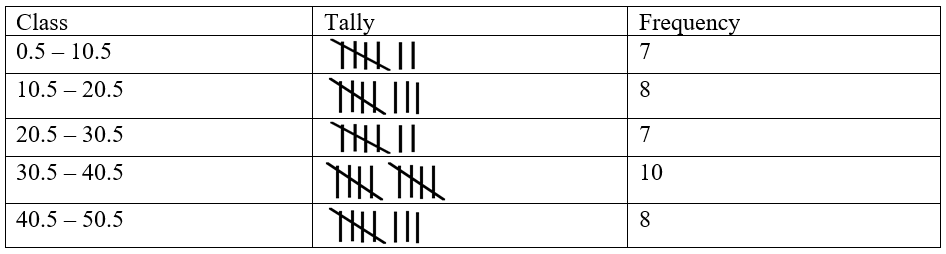
(iii) The true class limits of the third class = lower limit = 20.5 and upper limit = 30.5
(iv) The class mark of the fourth class (31 + 40)/2 = 71/2 = 35.5
7. Use the adjoining table to find:
(i) upper and lower limits of fifth class.
(ii) true class limits of the fifth class.
(iii) class boundaries of the third class.
(iv) class mark of the fourth class.
(v) width of sixth class.
| Class | Frequency |
| 28-32 | 5 |
| 33-37 | 8 |
| 38-42 | 13 |
| 43-47 | 9 |
| 48-52 | 7 |
| 53-57 | 5 |
| 58-62 | 2 |
Solution:
(i) Upper and lower limits of fifth class are as follows.
Upper limit = 52 and lower limit = 48
(ii) True class limits of the fifth class
Upper limit = 52.5 and lower limit = 47.5
(iii) Class boundaries of the third class is 37.5 and 42.5.
(iv) Class mark of the fourth class = (43 + 47)/2 = 90/2 = 45
(v) Width of sixth class = 57.5 – 52.5 = 5
8. The marks of 200 students in a test were recorded as follows:
| Marks % | 10-19 | 20-29 | 30-39 | 40-49 | 50-59 | 60-69 | 70-79 | 80-89 |
| No. of students | 7 | 11 | 20 | 46 | 57 | 37 | 15 | 7 |
Draw the cumulative frequency table.
Solution:
The cumulative frequency table is as follows:
| Marks % (Class) | Frequency | Cumulative Frequency |
| 10-19 | 7 | 7 |
| 20-29 | 11 | 18 |
| 30-39 | 20 | 38 |
| 40-49 | 46 | 84 |
| 50-59 | 57 | 141 |
| 60-69 | 37 | 178 |
| 70-79 | 15 | 193 |
| 80-89 | 7 | 200 |
9. Given below are the marks secured by 35 students in a test:
41, 32, 35, 21, 11, 47, 42, 00, 05, 18, 25, 24, 29, 38, 30, 04, 14, 24, 34, 44, 48, 33, 36, 38, 41, 46, 08, 34, 39, 11, 13, 27, 26, 43, 03.
Taking class intervals 0-10, 10-20, 20-30 …., construct frequency as well as cumulative frequency distribution table. Find the number of students obtaining below 20 marks.
Solution:
The cumulative frequency distribution table is given below:
| Class | Tally Marks | Frequency | Cumulative Frequency |
| 0-10 | 5 | 5 | |
| 10-20 | 5 | 10 | |
| 20-30 | 7 | 17 | |
| 30-40 | 10 | 27 | |
| 40-50 | 8 | 35 |
The number of students obtaining below 20 marks is 10.
10. The marks out of 100 of 50 students in a test are given below:
5 35 6 35 18 36 12 36 85 32
20 36 22 38 24 50 22 39 74 31
25 54 25 64 25 70 28 66 58 25
29 72 31 82 31 84 31 82 37 21
32 84 32 92 35 95 34 92 35 5
(i) Taking a class interval of size 10, construct a frequency as well as cumulative frequency table for the given data.
(ii) Which class has the largest frequency?
(iii) How many students score less than 40 marks?
(iv) How many students score first division (60% or more) marks?
Solution:
(i) The cumulative frequency table for the given data
| Class | Tally marks | Frequency | Cumulative frequency |
| 0-10 | III | 3 | 3 |
| 10-20 | II | 2 | 5 |
| 20-30 | 11 | 16 | |
| 30-40 | 18 | 34 | |
| 40-50 | 18 | 34 | |
| 50-60 | III | 3 | 37 |
| 60-70 | II | 2 | 39 |
| 70-80 | III | 3 | 42 |
| 80-90 | 5 | 47 | |
| 90-100 | III | 3 | 50 |
(ii) 30-40 is the class which has the largest frequency.
(iii) 34 students score less than 40 marks.
(iv) 13 students score first division (60% or more) marks.
11. Construct the frequency distribution table from the following data:
| Ages (in years) | Below 4 | Below 7 | Below 10 | Below 13 | Below 16 |
| No. of children | 7 | 38 | 175 | 248 | 300 |
State the number of children in the age group 10-13.
Solution:
The frequency distribution table from the given data:
| Class | Frequency |
| 0-4 | 7 |
| 4-7 | 31 |
| 7-10 | 137 |
| 10-13 | 73 |
| 13-16 | 52 |
Hence, the number of children in the age group 10-13 is 73.
12. Rewrite the following cumulative frequency distribution into frequency distribution:
Less than or equal to 10 2
Less than or equal to 20 7
Less than or equal to 30 18
Less than or equal to 40 32
Less than or equal to 50 43
Less than or equal to 60 50
Solution:
The given cumulative frequency distribution is rewritten into frequency distribution below:
| Class | Frequency |
| 0-10 | 2 |
| 11-20 | 5 |
| 21-30 | 11 |
| 31-40 | 14 |
| 41-50 | 11 |
| 51-60 | 7 |
13. The water bills (in rupees) of 32 houses in a locality are given below. Construct a
frequency distribution table with a class size of 10.
80, 48, 52, 78, 103, 85, 37, 94, 72, 73, 66, 52, 92, 85, 78, 81, 64, 60, 75, 78, 108, 63, 71, 54,
59, 75, 100, 103, 35, 89, 95, 73.
Solution:
A frequency distribution with a class size of 10 is follows:

14. The maximum temperatures (in degree Celsius) for Delhi for the month of April, 2014, as reported by the Meteorological Department, are given below:
27.4, 28.3, 23.9, 23.6, 25.4, 27.5, 28.1, 28.4, 30.5, 29.7, 30.6, 31.7, 32.2, 32.6, 33.4, 35.7, 36.1, 37.2, 38.4, 40.1, 40.2, 40.5, 41.1, 42.0, 42.1, 42.3, 42.4, 42.9, 43.1, 43.2.
Construct a frequency distribution table.
Solution:
The frequency distribution table of the given data is as follows:
| Class | Tally marks | Frequency |
| 23.5-27.5 | IIII | 4 |
| 27.5-31.5 | 7 | |
| 31.5-35.5 | IIII | 4 |
| 35.5-39.5 | IIII | 4 |
| 39.5-43.5 | 11 |
15. (i) The class marks of a distribution are 94, 104, 114, 124, 134, 144 and 154. Determine the class size and the class limits of the fourth class.
(ii) The class marks of a distribution are 9.5, 16.5, 23.5, 30.5, 37.5 and 44.5. Determine the class size and the class limits of the third class.
Solution:
(i) We know that
Class size is the difference between two successive class marks
Class size = 104 – 94 = 10
Class limits of the fourth class
Lower limit = 119 and upper limit = 129
(ii) We know that
Class size is the difference between two successive class marks
Class size = 16.5 – 9.5 = 7
Class limits of the third class
Lower limit = 20 and upper limit = 27.
Exercise 20.3
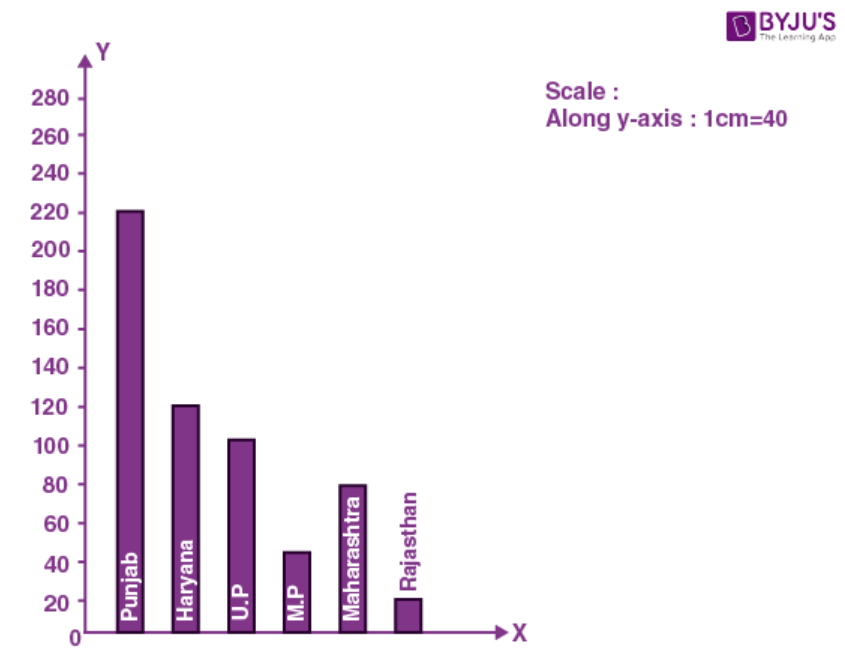
1. The area under wheat cultivation last year in the following states, correct to the nearest lacs hectares was:
| State | Punjab | Haryana | U.P. | M.P. | Maharashtra | Rajasthan |
| Cultivated area | 220 | 120 | 100 | 40 | 80 | 30 |
Represent the above information by a bar graph.
Solution:
The required bar graph is given below:
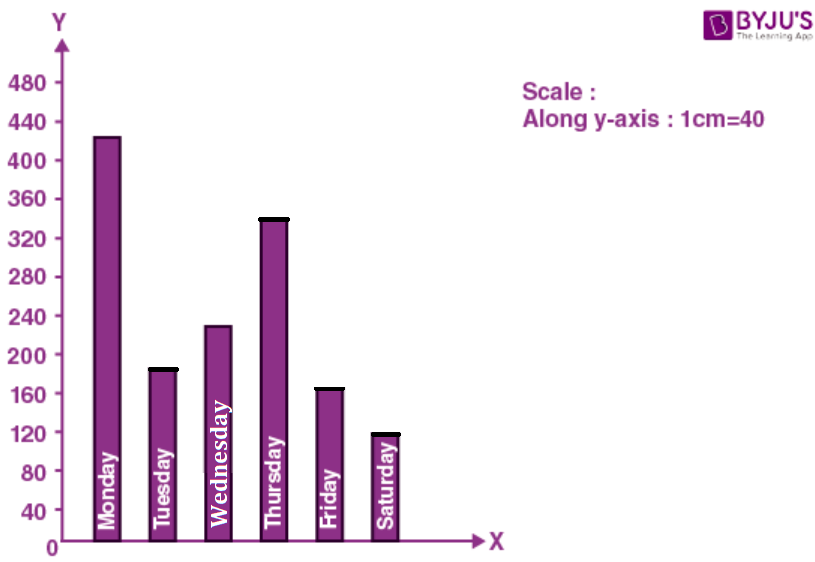
2. The number of books sold by a shopkeeper in a certain week was as follows:
| Day | Monday | Tuesday | Wednesday | Thursday | Friday | Saturday |
| No. of books | 420 | 180 | 230 | 340 | 160 | 120 |
Draw a graph for the above data.
Solution:
The required bar graph is given below:
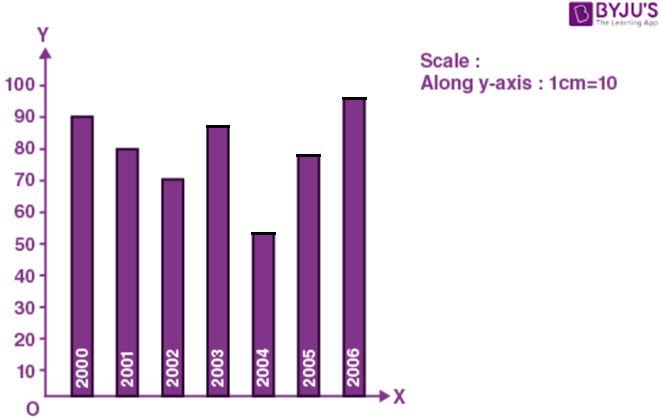
3. Given below is the data of percentage of passes of a certain school in the ICSE for consecutive years:
| Year | 2000 | 2001 | 2002 | 2003 | 2004 | 2005 | 2006 |
| % of passes | 92 | 80 | 70 | 86 | 54 | 78 | 94 |
Draw a bar graph to represent the above data.
Solution:
The required bar graph is given below:
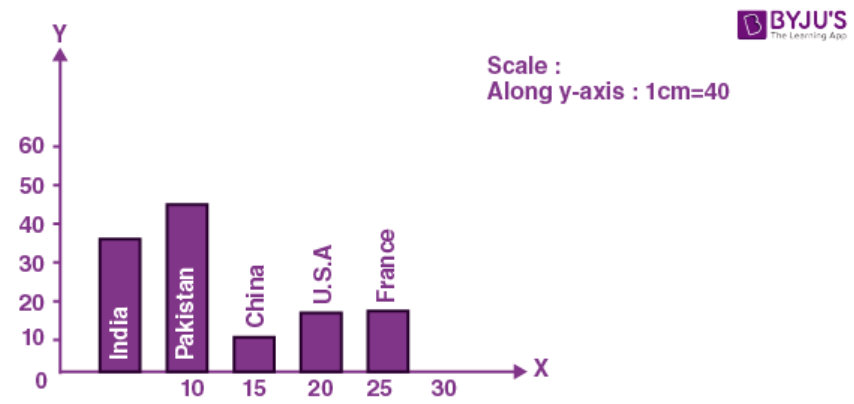
4. Birth rate per thousand of different countries over a certain period is:
| Country | India | Pakistan | China | U.S.A. | France |
| Birth rate | 36 | 45 | 12 | 18 | 20 |
Draw a horizontal bar graph to represent the above data.
Solution:
The required bar graph is given below:
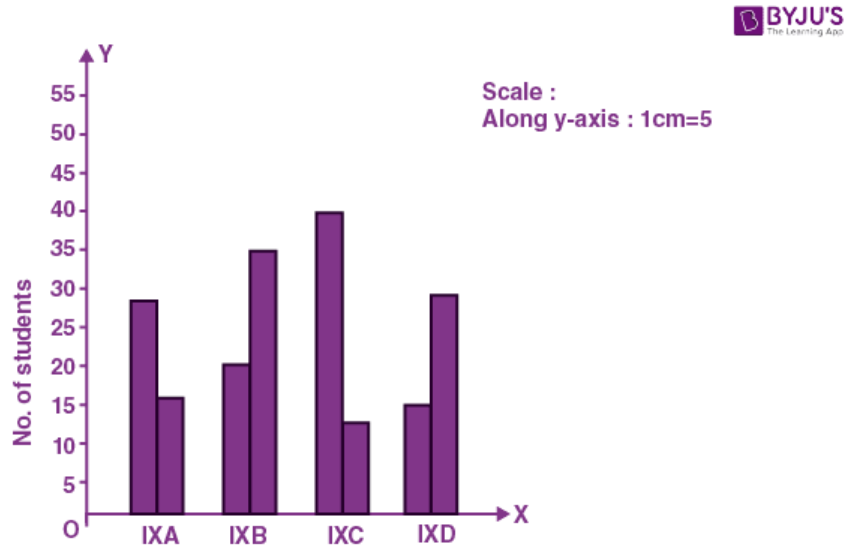
5. Given below is the data of number of students (boys and girls) in class IX of a certain school:
| Class | IX A | IX B | IX C | IX D |
| Boys | 28 | 22 | 40 | 15 |
| Girls | 18 | 34 | 12 | 25 |
Draw a bar graph to represent the above data.
Solution:
The required bar graph is given below:
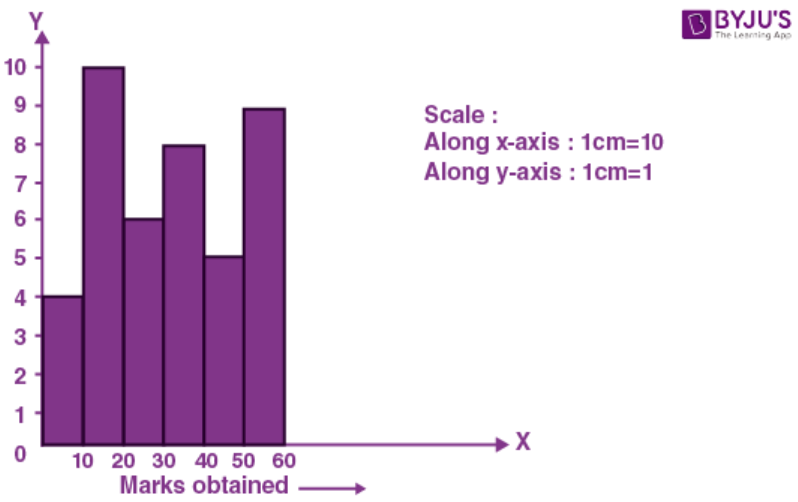
6. Draw a histogram to represent the following data:
| Marks obtained | 0-10 | 10-20 | 20-30 | 30-40 | 40-50 | 50-60 |
| No. of students | 4 | 10 | 6 | 8 | 5 | 9 |
Solution:
The required histogram is given below:
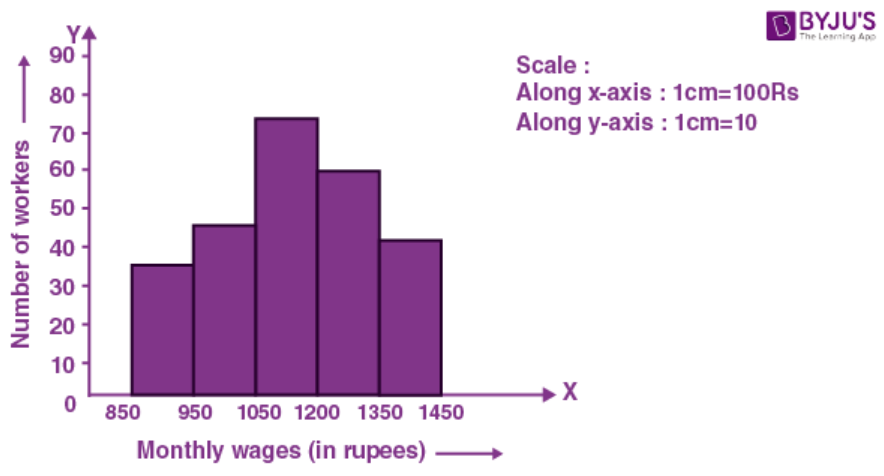
7. Draw a histogram to represent the following frequency distribution of monthly wages of 255 workers of a factory.
| Monthly wages (in rupees) | 850-950 | 950-1050 | 1050-1150 | 1150-1250 | 1250-1350 |
| No. of workers | 35 | 45 | 75 | 60 | 40 |
Solution:
The required histogram is given below:
8. Draw a histogram for the following data:
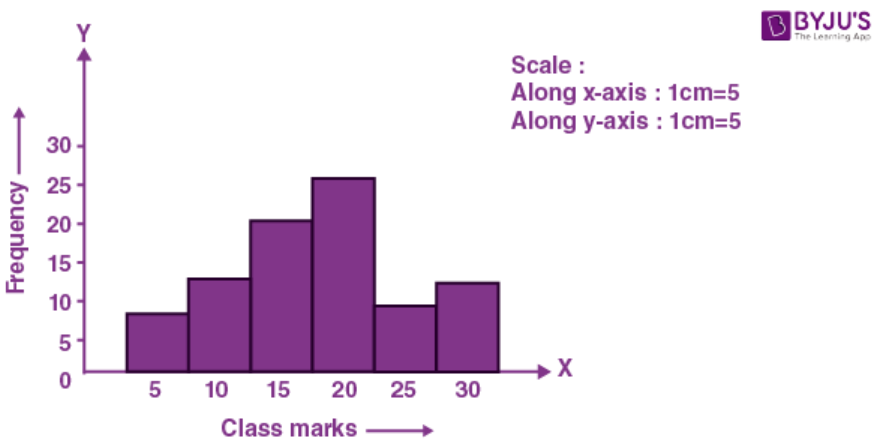
| Class marks | 12.5 | 17.5 | 22.5 | 27.5 | 32.5 | 37.5 |
| Frequency | 7 | 12 | 20 | 28 | 8 | 11 |
Solution:
The required histogram is given below:
9. Draw a histogram for the following frequency distribution:
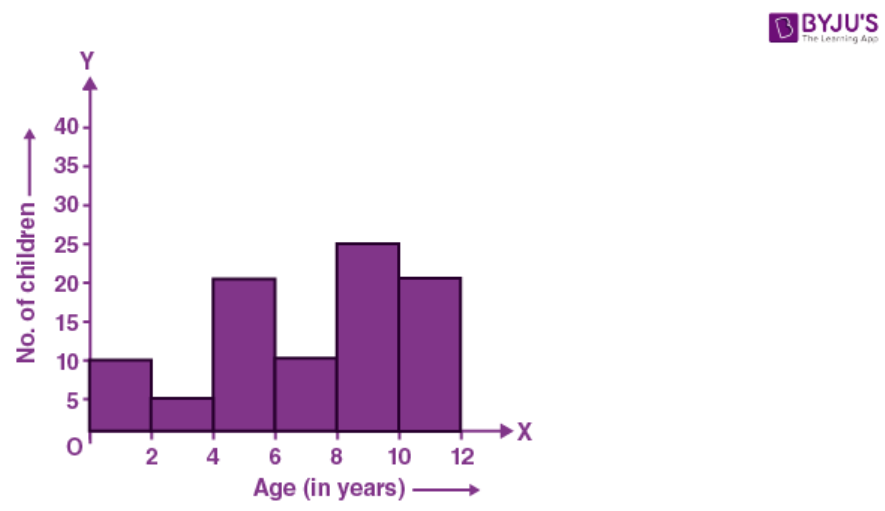
| Age (in years) | Below 2 | Below 4 | Below 6 | Below 8 | Below 10 | Below 12 |
| No. of children | 12 | 15 | 36 | 45 | 72 | 90 |
Solution:
First convert the given cumulative frequency into frequency distribution table:
| Age (in years) | c.f. | f. |
| 0-2 | 12 | 12 |
| 2-4 | 15 | 3 |
| 4-6 | 36 | 21 |
| 6-8 | 45 | 9 |
| 8-10 | 72 | 27 |
| 10-12 | 90 | 18 |
So represent age on x-axis and number of children on y-axis and draw the histogram as given below:
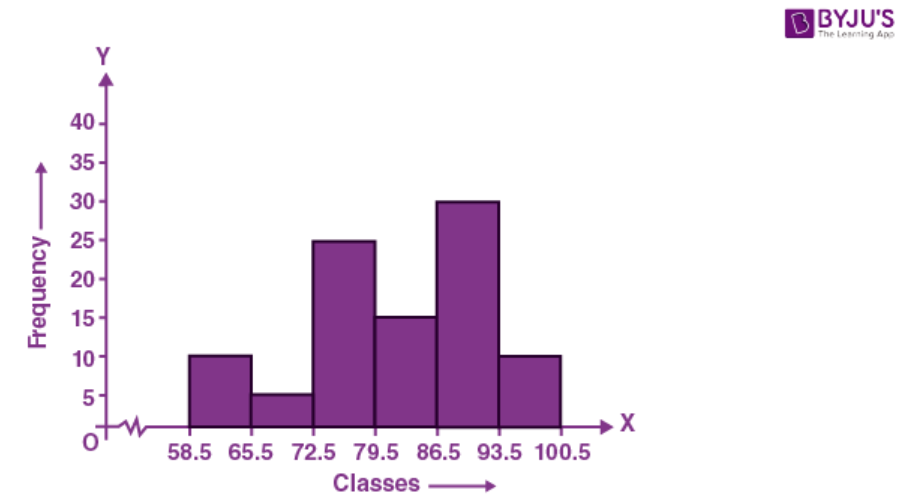
10. Draw a histogram for the following data:
| Classes | 59-65 | 66-72 | 73-79 | 80-86 | 87-93 | 94-100 |
| Frequency | 10 | 5 | 25 | 15 | 30 | 10 |
Solution:
First write the given data in continuous classes:
| Classes | Classes after adjustment | Frequency |
| 59-56 | 58.5-65.5 | 10 |
| 66-72 | 65.5-72.5 | 5 |
| 73-79 | 72.5-79.5 | 25 |
| 80-86 | 79.5-86.5 | 15 |
| 87-93 | 86.5-93.5 | 30 |
| 94-100 | 93.5-100.5 | 10 |
Represent classes on x-axis and frequency on y-axis and draw a histogram as given below:
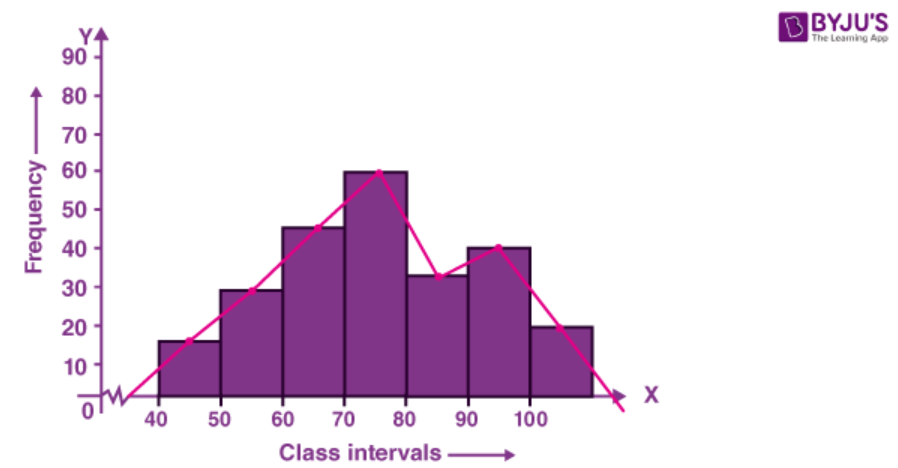
11. Draw a frequency polygon for the following data:
| Class intervals | 40-50 | 50-60 | 60-70 | 70-80 | 80-90 | 90-100 |
| Frequency | 15 | 28 | 45 | 32 | 41 | 18 |
Solution:
Take class intervals on x-axis and frequency on y-axis.
Construct a histogram and then taking the mid-point of each class join them with x-axis to get the frequency polygon.
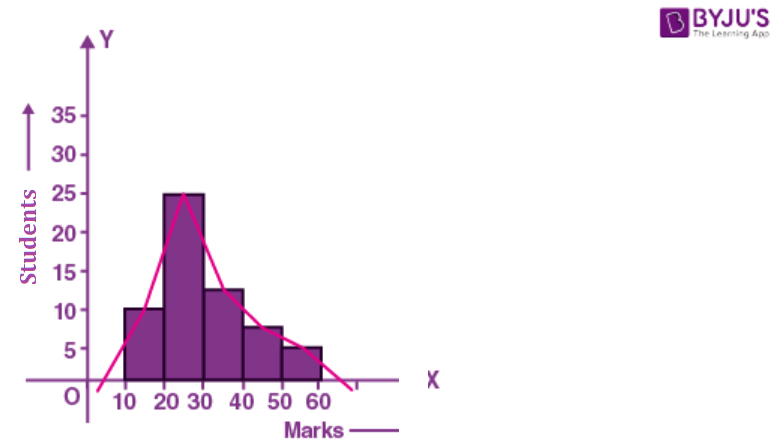
12. In a class of 60 students, the marks obtained in a monthly test were as under:
| Marks | 10-20 | 20-30 | 30-40 | 40-50 | 50-60 |
| Students | 10 | 25 | 12 | 08 | 05 |
Draw a frequency polygon to represent the above data.
Solution:
Consider marks on x-axis and number of students on y-axis.
Construct a histogram and then by joining the midpoints with x-axis we set a frequency polygon as given below.
13. In a class of 90 students, the marks obtained in a weekly test were as under:
| Marks | 16-20 | 21-25 | 26-30 | 31-25 | 36-40 | 41-45 | 46-50 |
| No. of students | 4 | 12 | 18 | 26 | 14 | 10 | 6 |
Draw a frequency polygon for the above data.
Solution:
Now write the classes as continuous classes:
| Marks | Classes after adjustment | Class Mark | No. of students (f) |
| 16-20 | 15.5-20.5 | 18.0 | 4 |
| 21-25 | 20.5-25.5 | 23.0 | 12 |
| 26-30 | 25.5-30.5 | 28.0 | 18 |
| 31-35 | 30.5-35.5 | 33.0 | 26 |
| 36-40 | 35.5-40.5 | 38.0 | 14 |
| 41-45 | 40.5-45.5 | 43.0 | 10 |
| 46-50 | 45.5-50.5 | 48.0 | 6 |
Represent marks on x-axis and frequency on y-axis and then draw frequency polygon as shown below:
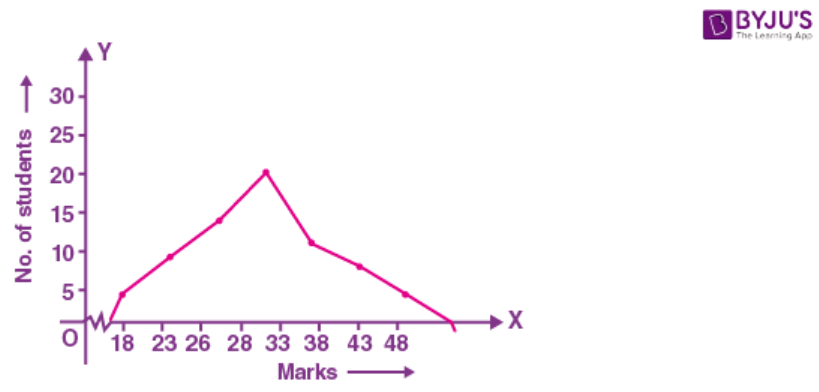
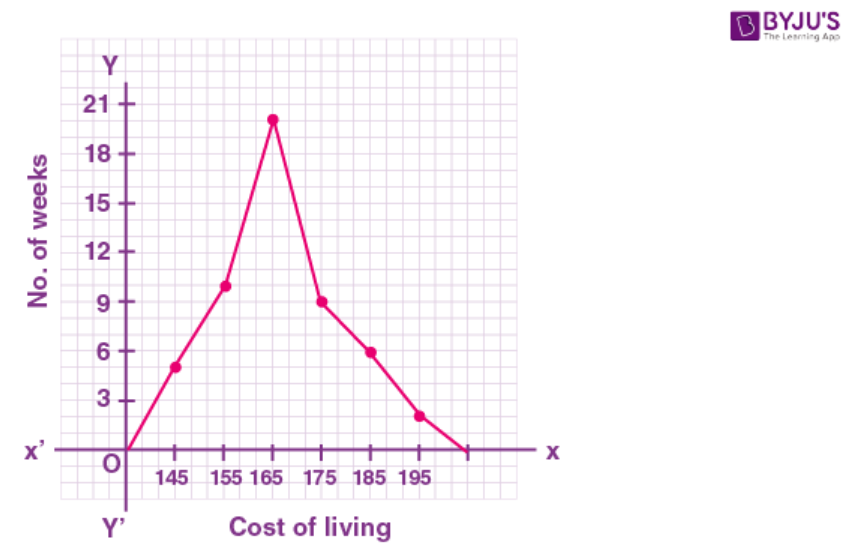
14. In a city, the weekly observations made in a study on the cost of living index are given in the following table:
| Cost of living index | 140-150 | 150-160 | 160-170 | 170-180 | 180-190 | 190-200 |
| Number of weeks | 5 | 10 | 20 | 9 | 6 | 2 |
Draw a frequency polygon for the data given above.
Solution:
| Cost of living index | No. of weeks | Mid-points |
| 140-150 | 5 | 145 |
| 150-160 | 10 | 155 |
| 160-170 | 20 | 165 |
| 170-180 | 9 | 175 |
| 180-190 | 6 | 185 |
| 190-200 | 2 | 195 |
Mark the mid-points of the cost of living index on x-axis and number of weeks on the y-axis.
Plot the mid-points and join them to form a frequency polygon as shown in the figure.
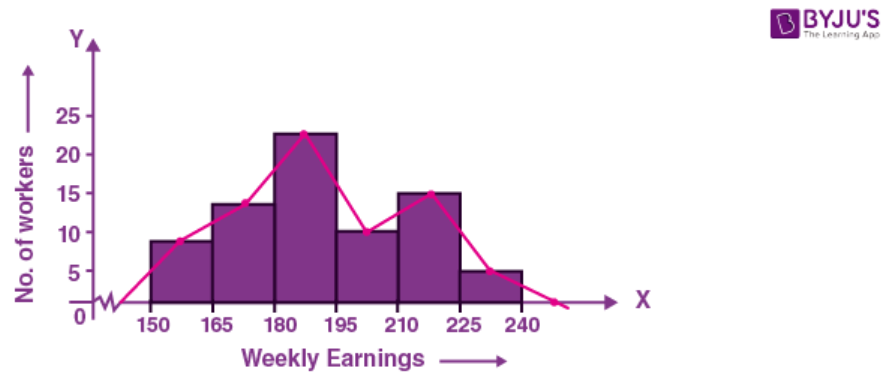
15. Construct a combined histogram and frequency polygon for the following data:
| Weekly earnings (in rupees) | 150-165 | 165-180 | 180-195 | 195-210 | 210-225 | 225-240 |
| No. of workers | 8 | 14 | 22 | 12 | 15 | 6 |
Solution:
Take weekly earnings on x-axis and number of workers on y-axis.
Draw histogram with given data and then by joining the mid-points of each class with x-axis we find frequency polygon as given below.
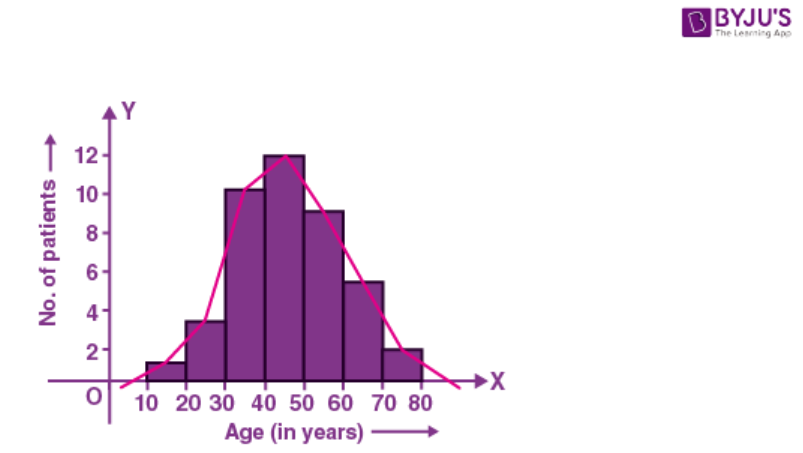
16. In a study of diabetic patients, the following data was obtained:
| Age (in years) | 10-20 | 20-30 | 30-40 | 40-50 | 50-60 | 60-70 | 70-80 |
| No. of patients | 3 | 8 | 30 | 36 | 27 | 15 | 6 |
Represent the above data by a histogram and a frequency polygon.
Solution:
Take age (in years) on x-axis and number of patients on y-axis.
Draw a histogram with the given data and then by joining the mid-points of the classes with x-axis, we get a frequency polygon as given below.
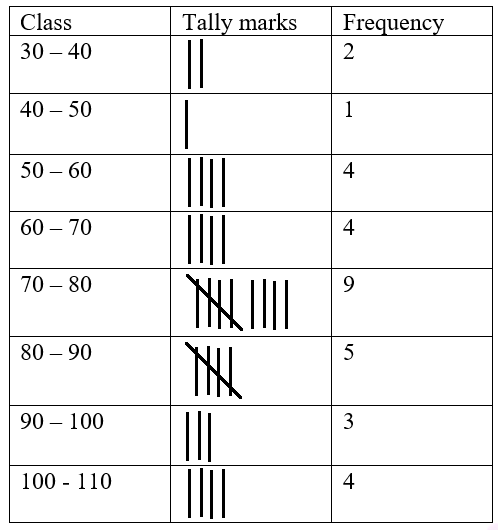
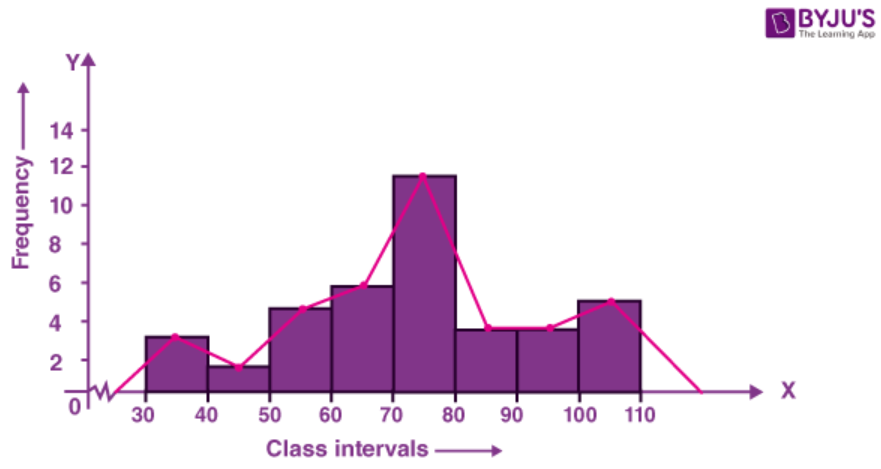
17. The water bills (in rupees) of 32 houses in a locality are given below:
30, 48, 52, 78, 103, 85, 37, 94, 72, 73, 66, 52, 92, 65, 78, 81, 64, 60, 75, 78, 108, 63, 71, 54, 59, 75, 100, 103, 35, 89, 95, 73.
Taking class intervals 30-40, 40-50, 50-60, ….. ,form frequency distribution table. Construct a combined histogram and frequency polygon.
Solution:
First represent the given data in the form of a frequency distribution table.
| Class Intervals | Tally Marks | Frequency |
| 30-40 | III | 3 |
| 40-50 | I | 1 |
| 50-60 | IIII | 4 |
| 60-70 | 5 | |
| 70-80 | 9 | |
| 80-90 | III | 3 |
| 90-100 | III | 3 |
| 100-110 | IIII | 4 |
Take class intervals on x-axis and frequency on y-axis and draw a histogram with the given data.
Join the mid-points of each class with x-axis, we get a frequency polygon as given below.
18. The number of matchsticks in 40 boxes on counting was found as given below:
44, 41, 42, 43, 47, 50, 51, 49, 43, 42, 40, 42, 44, 45, 49, 42, 46, 49, 45, 49, 45, 47, 48, 43, 43, 44, 48, 43, 46, 50, 43, 52, 46, 49, 52, 51, 47, 43, 43, 45.
Taking classes 40-42, 42-44 ….., construct the frequency distribution table for the above data. Also draw a combined histogram and frequency polygon to represent the distribution.
Solution:
First represent the given data in a frequency distribution table as shown below:
| Class Intervals | Tally Marks | Frequency |
| 40-42 | II | 2 |
| 42-44 | 12 | |
| 44-46 | 7 | |
| 46-48 | 6 | |
| 48-50 | 7 | |
| 50-52 | IIII | 4 |
| 52-54 | II | 2 |
| Total | 40 |
Take class on x-axis and frequency on y-axis and draw histogram with the given data.
Join the mid-point of each class with the x-axis, we get a frequency polygon as given below.
19. The histogram showing the weekly wages (in rupees) of workers in a factory is given alongside.
Answer the following about the frequency distribution:
(i) What is the frequency of the class 400-425?
(ii) What is the class having minimum frequency?
(iii) What is the cumulative frequency of the class 425 – 450?
(iv) Construct a frequency and cumulative frequency table for the given distribution.
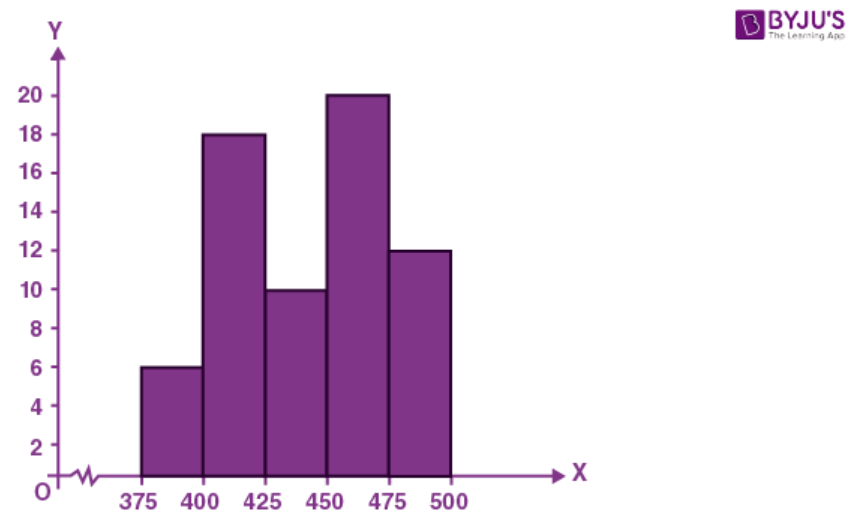
Solution:
From the figure given in the question, we get
(i) The frequency of the class 400-425 is 18.
(ii) The class having minimum frequency is 475-500.
(iii) The cumulative frequency of the class 425-450 is (6 + 18 + 10) = 34.
(iv) The frequency table for the given distribution is:
| Classes | Frequency | Cumulative Frequency |
| 375-400 | 6 | 6 |
| 400-425 | 18 | 24 |
| 425-450 | 10 | 34 |
| 450-475 | 20 | 54 |
| 475-500 | 4 | 58 |
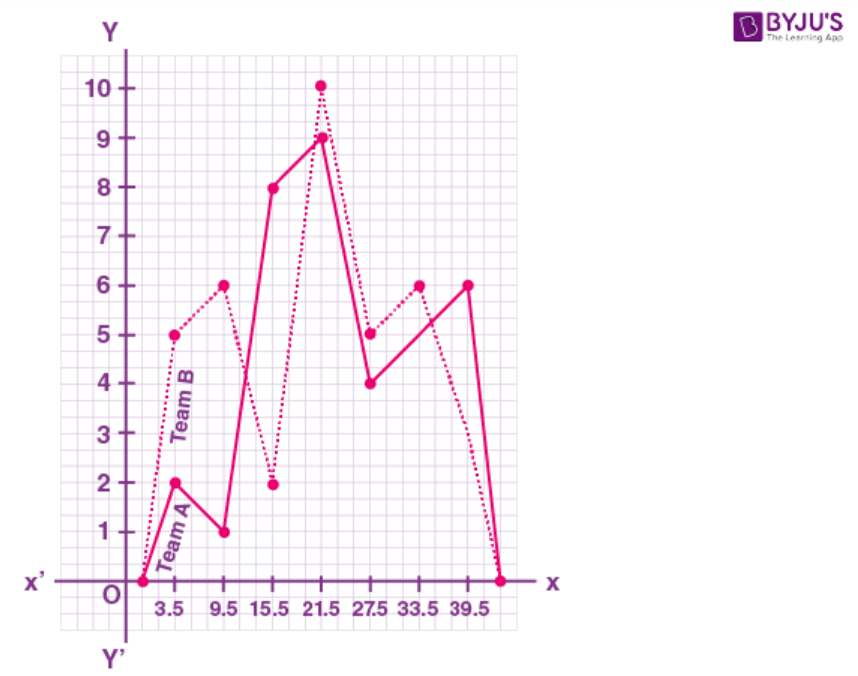
20. The runs scored by two teams A and B on the first 42 balls in a cricket match are given below:
| No. of balls | 1-6 | 7-12 | 13-18 | 19-24 | 25-30 | 31-36 | 37-42 |
| Runs scored by Team A | 2 | 1 | 8 | 9 | 4 | 5 | 6 |
| Runs scored by Team B | 5 | 6 | 2 | 10 | 5 | 6 | 3 |
Draw their frequency polygons on the same graph.
Solution:
| No. of balls | Class marks | Team A | Team B |
| 1-6 | 3.5 | 2 | 5 |
| 7-12 | 9.5 | 1 | 6 |
| 13-18 | 15.5 | 8 | 2 |
| 19-24 | 21.5 | 9 | 10 |
| 25-30 | 27.5 | 4 | 5 |
| 31-36 | 33.5 | 5 | 6 |
| 37-42 | 39.5 | 6 | 3 |
Frequency polygons for both the teams is given on the same graph below:
Chapter test
1. Find the mean and the median of the following set of numbers:
8, 0, 5, 3, 2, 9, 1, 5, 4, 7, 2, 5.
Solution:
By arranging in descending order
0, 1, 2, 2, 3, 4, 5, 5, 5, 7, 8, 9
n = 12 which is even
Mean (x̄) = Ʃ xi/ n
Substituting the values
= (0 + 1 + 2 + 2 + 3 + 4 + 5 + 5 + 5 + 7 + 8 + 9)/12
By further calculation
= 51/12
= 17/4
= 4.25
Median = ½ [12/2th + (12/2 + 1)th terms]
= ½ [6th + 7th terms]
Substituting the values
= ½ (4 + 5)
= 9/2
= 4.5
2. Find the mean and the median of all the (positive) factors of 48.
Solution:
We know that
Positive factors of 48 are
1, 2, 3, 4, 6, 8, 12, 16, 24, 48
Here N = 10 which is even
Mean (x̄) = Ʃ xi/ n
Substituting the values
= (1 + 2 + 3 + 4 + 6 + 8 + 12 + 16 + 24 + 48)/10
So we get
= 124/10
= 12.4
Median = ½ [10/2 th + (10/2 + 1)th terms]
= ½ [5th + 6th terms]
Substituting the values
= ½ (6 + 8)
= 14/2
= 7
3. The mean weight of 60 students of a class is 52.75 kg. If the mean weight of 35 of them is 54 kg, find the mean weight of the remaining students.
Solution:
It is given that
Mean weight of 60 students of a class = 52.75 kg
So the total weight of 60 students = 52.75 × 60 = 3165 kg
Mean weight of 35 students among them = 54 kg
So the total weight of 35 students = 54 × 35 = 1890 kg
Remaining students = 60 – 35 = 25
Total weight of 25 students = 3165 – 1890 = 1275 kg
So the mean weight of 25 students = 1275 ÷ 25 = 51 kg
Hence, the mean weight of the remaining students is 51 kg.
4. The mean age of 18 students of a class is 14.5 years. Two more students of age 15 years and 16 years join the class. What is the new mean age?
Solution:
It is given that
Mean age of 18 students = 14.5 years
Total age = 14.5 × 18 = 261 years
Total age of 2 more students = 15 + 16 = 31 years
Total age of 18 + 2 = 20 students = 261 + 31 = 292 years
Mean age = 292/20 = 14.6 years
Hence, the new mean age is 14.6 years.
5. If the mean of the five observations x + 1, x + 3, x + 5, 2x + 2, 3x + 3 is 14, find the mean of first three observations.
Solution:
We know that
Mean of the five observations
x + 1, x + 3, x + 5, 2x + 2, 3x + 3 is 14
Mean = (x + 1 + x + 3 + x + 5 + 2x + 2 + 3x + 3)/5
By further calculation
= (8x + 14)/5
Equating to mean
(8x + 14)/5 =14
By cross multiplication
8x + 14 = 70
So we get
8x = 70 – 14 = 56
By division
x = 56/8 = 7
Mean of x + 1 + x + 3 + x + 5
We get
Mean = (x + 1 + x + 3 + x + 5)/3
By further calculation
= (3x + 9)/3
= x + 3
Substituting the value of x
= 7 + 3
= 10
Hence, the mean of first three observations is 10.
6. The mean height of 36 students of a class is 150.5 cm. Later on, it was detected that the height of one student was wrongly copied as 165 cm instead of 156 cm. Find the correct mean height.
Solution:
It is given that
Mean height of 36 students of a class = 150.5 cm
Total height = 150.5 × 36 = 5418 cm
Difference in height which was wrongly copied = 165 + 56 = 9 cm
Actual height = 5418 – 9 = 5409 cm
Actual mean height = 5409/36 = 150.25 cm
Hence, the correct mean height is 150.25 cm.
7. The mean of 40 items is 35. Later on, it was discovered that two items were misread as 36 and 29 instead of 63 and 22. Find the correct mean.
Solution:
It is given that
Mean of 40 items = 35
Total of 40 items = 35 × 40 = 1400
Difference between two items which were wrongly read = (63 + 22) – (36 + 29)
By further calculation
= 85 – 65
= 20
Here
Actual total = 1400 + 20 = 1420
Correct mean = 1420/40 = 35.5
Hence, the correct mean is 35.5.
8. The following observations have been arranged in ascending order. If the median of the data is 63, find the value of x.
29, 32, 48, 50, x, x + 2, 72, 75, 87, 91.
Solution:
We know that
N = 10 which is even
Median = ½ [n/2 th + (n/2 + 1)th term]
It can be written as
63 = ½ [10/2th + (10/2 + 1)th term]
63 = ½ (5th + 6th terms)
Substituting the values
63 = ½ (x + x + 2)
63 × 2 = 2x + 2
By further calculation
2x = 126 – 2 = 124
By division
x = 124/2 = 62
Therefore, the value of x is 62.
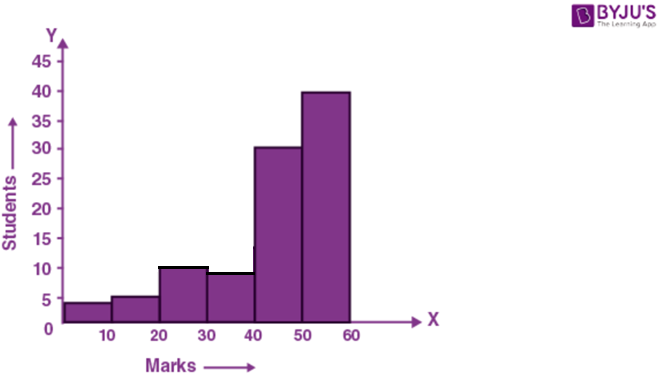
9. Draw a histogram showing marks obtained by the students of a school in a Mathematics paper carrying 60 marks.
| Marks | 0-10 | 10-20 | 20-30 | 30-40 | 40-50 | 50-60 |
| Students | 4 | 5 | 10 | 8 | 30 | 40 |
Solution:
Represent marks on x-axis and number of students on y-axis and draw a histogram as shown below:
10. In a class of 60 students, the marks obtained in a surprise test were as under:
| Marks | 14-20 | 20-26 | 26-32 | 32-38 | 38-44 | 44-50 | 50-56 | 56-62 |
| No. of students | 4 | 10 | 9 | 15 | 12 | 5 | 3 | 2 |
Represent the above data by a histogram and a frequency polygon.
Solution:
Take marks on x-axis and number of students on the y-axis. Draw a histogram from the given data and then by joining the mid-point of each class with x-axis we obtain a frequency polygon as given below.
11. Construct a combined histogram and frequency polygon for the following distribution:
| Classes | 91-100 | 101-110 | 111-120 | 121-130 | 131-140 | 141-150 | 151-160 |
| Frequency | 16 | 28 | 44 | 20 | 32 | 12 | 4 |
Solution:
Write the classes in continuous frequency classes:
| Classes | Classes after adjustment | Frequency |
| 91-100 | 90.5-100.5 | 16 |
| 101-110 | 100.5-110.5 | 28 |
| 111-120 | 110.5-120.5 | 44 |
| 121-130 | 120.5-130.5 | 20 |
| 131-140 | 130.5-140.5 | 32 |
| 141-150 | 140.5-150.5 | 12 |
| 151-160 | 150.5-160.5 | 4 |
Represent classes on x-axis and frequency on y-axis and draw first histogram and from it we can draw a frequency polygon as given below:
12. The electricity bills (in rupees) of 40 houses in a locality are given below:
78 87 81 52 59 65 101 108 115 95
98 65 62 121 128 63 76 84 89 91
65 101 95 81 87 105 129 92 75 105
78 72 107 116 127 100 80 82 61 118
Form a frequency distribution table with a class size of 10. Also represent the above data with a histogram and frequency polygon.
Solution:
We know that
Least term = 52
Greatest term = 129
Range = 129 – 52 = 77
Construct a frequency distribution table:
| Class Interval | Tally Numbers | Frequency |
| 50-60 | II | 2 |
| 60-70 | 6 | |
| 70-80 | 5 | |
| 80-90 | 8 | |
| 90-100 | 5 | |
| 100-110 | 7 | |
| 110-120 | III | 3 |
| 120-130 | IIII | 4 |
| Total | 40 |
Take class intervals on x-axis and frequency on y-axis
Histogram and frequency polygon are shown below:
13. The data given below represent the marks obtained by 35 students:
21 26 21 20 23 24 22 19 24
26 25 23 26 29 21 24 19 25
26 25 22 23 23 27 26 24 25
30 25 23 28 28 24 28 28
Taking class intervals 19-20, 21-22 etc., make a frequency distribution for the above data.
Construct a combined histogram and frequency polygon for the distribution.
Solution:
It is given that
Least mark = 19
Greatest marks = 30
Range = 30 – 19 = 11
Construct the frequency distribution table-
| Class Interval | Actual Intervals | Frequency |
| 19-20 | 18.5-20.5 | 3 |
| 21-22 | 20.5-22.5 | 5 |
| 23-24 | 22.5-24.5 | 10 |
| 25-26 | 24.5-26.5 | 10 |
| 27-28 | 26.5-28.5 | 5 |
| 29-30 | 28.5-30.5 | 2 |
| Total | 35 |
Take class interval on x-axis and frequency on the y-axis
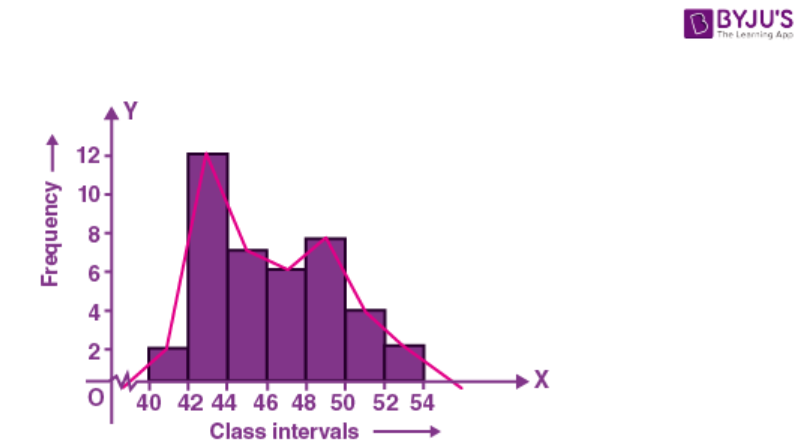
Histogram and frequency polygon are show below.
14. The given histogram and frequency polygon shows the ages of teachers in a school. Answer the following:
(i) What is the class size of each class?
(ii) What is the class whose class mark is 48?
(iii) What is the class whose frequency is maximum?
(iv) Construct a frequency table for the given distribution.
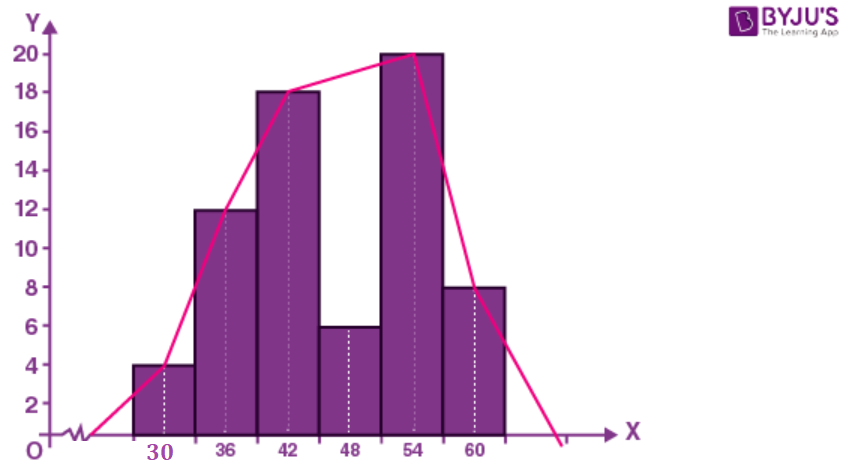
Solution:
(i) The class size of each class is 6.
(ii) The class whose class mark is 48 is 45 – 51
It can be written as
= (45 + 51)/2
= 96/2
= 48
(iii) The class 51-57 has the maximum frequency i.e., 20.
(iv) Frequency table for the given distribution:
| Classes | 27-33 | 33-39 | 39-45 | 45-51 | 51-57 | 57-63 |
| Frequency | 4 | 12 | 18 | 6 | 20 | 8 |
Comments