Statistics normally means taking the values of some quantities and by plotting it or by arranging it in a meaningful manner. It gives us the process by which we can collect, analyze, interpret, present, and organize data. Measures of central tendency and measures of dispersion are two important types of statistics. A measure of central tendency represents the center or middle of a set of data values. The commonly used measures of central tendency are mean, median, and mode. In this article, we will discuss how to calculate the measures of central tendency and dispersion along with important formulas.
What are the Measures of Central Tendency and Dispersion?
1. Mean: It is the average of all the values given in a set of data.
2. Mode: The mode is the number that appears most frequently in a set of data. We can find the mode by counting the number of times each value occurs in a data set.
3. Median: Median is the most middle value in a set of data. Let n denotes the number of observations in a data set. If n is odd, the median equals the [(n+1)/2]th observation.
If n is even, then the median is given by the mean of (n/2)th observation and [(n/2)+1]th
Observation.
4. Mean deviation: It is the mean of the absolute values of the numerical differences between the numbers of a set and their mean or median.
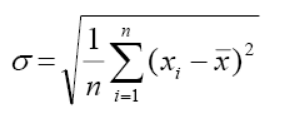
5. Standard deviation: It computes the dispersion of a dataset relative to its mean.
6. Range: It gives a measure of the spread of the data values of the corresponding random variable.
7. Quartile deviation: It is half the difference between the first quartile and the third quartile in a frequency distribution.
Formula
1. Mean = [number of observations]/[total number of observations]
For grouped data, mean is:
2. Median for ungrouped data:
Median = [(n+1)/2]th observation, if n is odd.
Median = mean of (n/2)th observation and [(n/2)+1]th observation, if n is even.
Median for grouped data:
3. Mode: To find the mode, arrange the given data in the ascending order. Then count how many times each number is occurring. The number that occurs most, is the mode.
Estimating mode from grouped data: Find the group with the highest frequency (modal group).
Estimated mode = L +[(fm-fm-1)/(fm-fm-1)+(fm-fm+1)]×W
L denotes the lower class boundary of the modal group.
fm-1 denotes the frequency of the group before the modal group.
fm denotes the frequency of the modal group.
fm+1 denotes the frequency of the group after the modal group.
W denotes the group width.
4. Standard Deviation:
5. Mean deviation
For grouped frequency distribution,
6. Range = L – S
Here L is the maximum value attained by the random variable under consideration and S is the minimum value.
7. Quartile deviation
Practice Problems
Problem 1: Find the mean, median, mode and range for the given data:
44, 79, 94, 43, 53, 65, 87, 90, 70, 69, 65, 89, 85, 53, 47, 61, 27, 80
Problem 2: The weights, in grams, of seven sweet potatoes are
260, 225, 205, 240, 232, 205, 214
What is the median weight?
Measures of Central Tendency for an Ungrouped Data

Frequently Asked Questions
What are the measures of central tendency and dispersion?
Mean , mode, median, mean deviation, standard deviation, range and quartile deviation are the measures of central tendency and dispersion.
What do you mean by Mode in statistics?
Mode is the observation which occurs the maximum number of times.
Give the formula to calculate the Quartile deviation.
Quartile deviation = (Q3-Q1)/2. Q1 is the lower quartile and Q3 is the upper quartile.

Comments