Tally marks are an exciting and easy topic of statistics. Generally, tally marks and graphs are used to keep and count the score. The symbol ‘|’ is used to denote the value one. In earlier days, before the discovery of the numbers, it was tough to keep track of the individual belongings of people, e.g., humans used to have domestic animals such as goats and cows thus, keeping track of their count was very hard if the number was huge. At that time, tally marks were beneficial.
Tally Marks Definition
Tally marks are defined in the unary numeral system. It is a form of numeral used for counting. The general way of writing tally marks is as a group or set of five lines. The first four lines are drawn vertically and each of the fifth line runs diagonally over the previous four vertical lines, i.e. from the top of the first line to the bottom of the fourth line.
Counting Tally Marks
Tally marks are the fastest way of keeping track of numbers in groups of five. See the figure below to understand the logic.
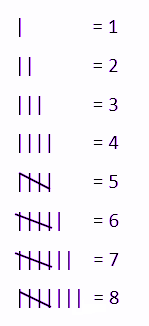
We can see here;
- One is expressed by ‘|’ tally mark.
- Two is represented by ‘| |’ tally marks.
- Three is represented by ‘| | |’ tally marks.
- Four is denoted by ‘||||’ tally marks.
- Five is not denoted by ‘| | | | |’ tally marks in the graphs. For the number 5, draw four vertical lines (||||) with a diagonal (\) line through it.
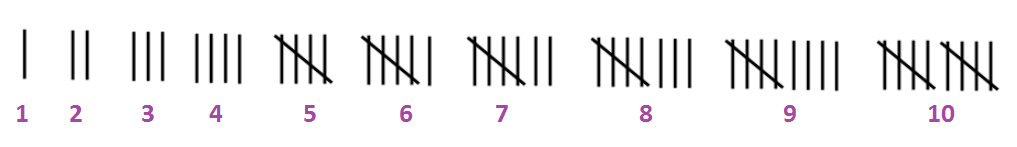
Tally Mark Chart
Tally mark chart or graph is a graphical representation of the data in statistics. It is beneficial in scanning the data. Graph table has one vertical line which is made for each of the first four numbers and the fifth number is represented by a diagonal line across the previous four. Below chart contains tally marks for the numbers counting from 1 to 10.
Tally marks are used to find-
Suppose we are asked to create a frequency distribution provided with raw data or random values. In this case, we may have to make either for individual observations or class intervals. If we count all the occurrences of a single data value or a class interval in one go, we will have to cross-check the entire list again and again for the next observation or class interval. Hence, this will take a lot of time to finish. The complexity of this can be reduced by making use of tally marks. This can be done just by adding tally marks for each different observation or class interval. Therefore, we have to traverse the entire list of given data set only once. And then write the frequency numbers by counting the tally marks after finishing identification. Hence, the obtained table is defined as the frequency distribution table for the given data.
In this way, tally marks are used to find the frequency of the set of data values, more specifically for the given ungrouped raw data. Below solved example questions will help you in understanding this concept in a better way.
Tally Marks Questions
Q 1: Let’s consider the marks of 25 students in standard IX in a particular school. The scores are as follows:
41, 53, 64, 31, 53, 33, 70, 61, 74, 32, 53, 56, 56, 64, 56, 88, 28, 70, 56, 64, 74, 53, 53, 61, 31.
The maximum mark allotted to the paper is 100. Draw a tally chart for the above data.
Solution: Rearranged data in ascending order:

Using the tally mark table, different data can be obtained without actually going through the observations.
Q.2: Consider a garden with lots of flowers. Mary has different types of flower pots which are given in the table below:

Using this table, answer the below questions:
(i) How many Daisy flower pots are there?
(ii) Which two flowers have the same number of pots?
(iii) Which flower has the maximum number of pots?
Solution:
Using the given tally mark table, we can easily get the required information without actually going through the observations.
(i) It can be seen that there are two tally marks in front of the Daisy row. So the number of Daisy flower pots is 2.
(ii) It can be seen that in front of Lily and Jasmine, the number of tally marks is 4. So both Lily and Jasmine have the same number of pots.
(iii) In the table, the maximum number of tally marks 10, can be seen only in the Tulip row. So, the Tulip has the maximum number of pots.
To learn more about frequency distribution and other related concepts, visit byjus.com. Also, for engaging videos of all the important maths concepts, download BYJU’S – The Learning App.