
| Meaning | It is a graphical representation of all the possible combinations of two goods that can be produced by the optimum (fuller) utilisation of available resources and the given technology.
It gives us the maximum limit of goods and services that could be produced. So, it is also known as the production possibility boundary or production possibility frontier (PPF). |
||||||||||||||||||||||||||||
| Shape of PPC |
|
||||||||||||||||||||||||||||
| Reason of Concave Shape of PPC | It is downward sloping because to produce one more unit of resource, we have to sacrifice a few units of another one as the resources are already being fully utilised.
Production Possibility Curve is concave-shaped due to increasing MRT, i.e., to produce every additional unit of a commodity, more and more units of another commodity are sacrificed. {Reason for increasing MRT: Resources are not equally efficient} |
||||||||||||||||||||||||||||
| Tabular Representation |
In the given table, it is shown that, for having agricultural goods, we have to sacrifice some units of capital goods. Initially, when we move from combination A to B to gain one unit of agricultural goods, we have to sacrifice one unit of capital goods. Further, if we have to gain one more unit of agricultural goods, then we will have to sacrifice two, three, four, and five Units of capital goods, respectively. In the schedule, it is shown that, for every additional unit of agricultural goods, the marginal opportunity cost (in terms of loss of output of capital goods to the gain of agricultural goods) tends to rise. |
| Shifting of PPC to Right | PPC shifts to rightward because of the following reasons.
|
| Diagram | 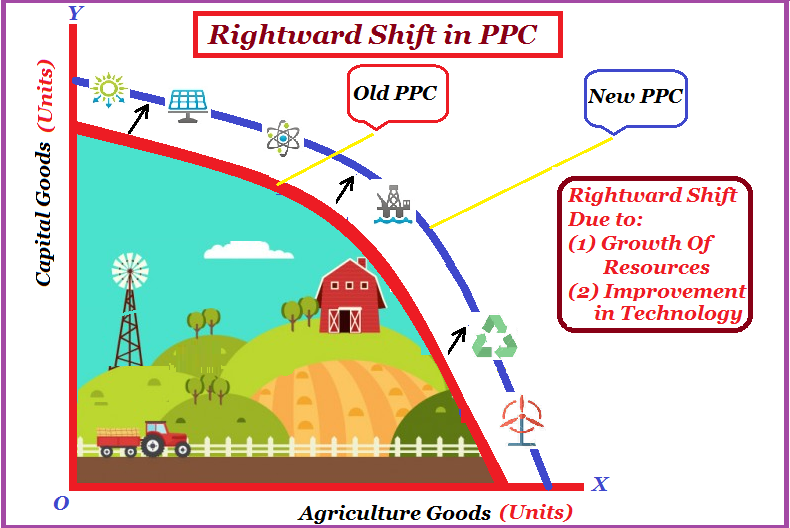 |
| Let us Practice |
| 1. PPC is concave-shaped as the production of one good can be increased only by increasing the production of another good.
a) True b) False |
| 2. The marginal rate of transformation can be written as
a) Gain – loss b) Loss × Gain c) Loss/Gain d) Gain/Loss |
| 3. ___________________is a graphical representation of all the possible combinations of two goods that can be produced by the optimum utilisation of available resources and the given technology. |
| 4. The growth of resources leads to ______________ shift of PPC. |
| 5. A point outside the PPC indicates ____________________ |
| ANSWERS: |
| 1. a) False
2. c) Loss/Gain 3. Production possibility frontier/PPC 4. Rightward 5. Unattainable combination |
Also See:
Comments