In business, a production possibility curve (PPC) is made to evaluate the performance of a manufacturing system when two commodities are manufactured together. The management utilises this graph to plan the perfect proportion of goods to produce in order to reduce the wastage and costs while maximising profits.
The diagram or graph explains the units of goods that a company can produce if all the resources are utilised productively. Therefore, a single commodity’s maximum manufacturing probability is arranged on the X-axis and that of the other commodity on the Y-axis. Here, the curve is represented to show the number of products that can be created with limited resources, while pausing the use of technology in between.
In the graph, the line sloping down also depicts the trade-off between producing commodity A and commodity B. When a firm diverts its resources to produce commodity B, the production of commodity A reduces.
A point above the curve indicates the unattainable with the available resources. A point below the curve means that the production is not utilising 100 percent of the business’ resources.
Related link: What is Demand?
Production Possibilities Curve Example
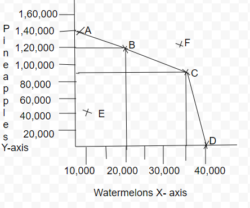
The production of 20,000 watermelons and 1,20,000 pineapples is shown on point B in the graph. If the production of watermelons needs to be more, then the production of pineapples should be less. On the graph, point C indicates that if the production of watermelons has to be 45,000, then the company can deliver only 85,000 pineapples. With this trade-off, the curve shows the idea of opportunity cost.
The production possibility curve also shows the choice of society between two different products.
You might want to know: What is Consumer Equilibrium?
Production Possibilities Curve Diagram

| Shape of PPC | ● It is downward sloping and concave to the point of origin. |
| Reasons for such shape of PPC | ● It is downward sloping because of the few units we sacrifice for the others, as there exists an inverse relationship between the change in quantity of one commodity and the change in quantity of the other commodities.
● PPC is concave-shaped because more and more units of one commodity are sacrificed to gain an additional unit of another commodity. |
| Underutilisation of resources
(Any point under the PPC) |
● However, if there is unemployment or inefficiency in resource utilisation, then we can produce at any point inside the PPC. |
Must Read: How to Study Economics Effectively
This concept explains the production possibilities curve. Stay tuned for questions papers, sample papers, syllabus, and relevant notifications on our website.
Thanks it was useful 😊😊🙏😻
Thank you 😇
Thanks I totally understand every line easily thanks again 🙏🙏
I totally understood all the words very easily, Thanks for helping me!