Important questions for Class 10 Maths Chapter 14 Statistics are available at BYJU’S, created and designed as per the latest exam pattern by referring to the CBSE board sample papers. Students who are preparing for the CBSE class 10 board exams 2022-23 can practice these Statistics questions to score full marks for the questions from this chapter.
This chapter is important for students from the examination perspective. Most of the long answer questions will come from this chapter for the exam. Students can also refer to the solutions prepared by BYJU’S expert teachers. By solving these Important Questions of Class 10 Maths Chapter 14 Statistics, students will thoroughly revise this chapter and get well versed with the questions expected to be asked in the Maths paper.
Also, check: Class 10 Maths Chapter 14 Statistics MCQs
Read more:
Important Questions & Answers For Class 10 Maths Chapter 14 Statistics
The important questions of the statistics chapter for class 10 are given here in both short answer type and long answer type.
Short Answer Type Questions
Q.1. Find the mean of the 32 numbers, such that if the mean of 10 of them is 15 and the mean of 20 of them is 11. The last two numbers are 10.
Solution: The given mean of 10 numbers = 15
So, Mean of 10 numbers = sum of observations/ no. of observations
15 = sum of observations / 10
Sum of observations of 10 numbers = 150
Similarly, Mean of 20 numbers = sum of observations/ no. of observations
11 = sum of observations / 20
Sum of observations of 20 numbers = 220
Hence, Mean of 32 numbers = (sum 10 numbers + sum of 20 numbers + sum of last two numbers)/ no. of observations
Mean of 32 numbers = (150 + 220 + 20 ) / 32 = 390 /32 = 12.188
Q.2. Find the mean of the first 10 natural numbers.
Solution: The first 10 natural numbers are 1, 2, 3, 4, 5, 6, 7, 8, 9, 10
Mean = (1 + 2 +3 + 4 + 5 + 6 + 7 + 8 + 9 + 10) / 10 = 55/10 = 5.5
Q.3. Find the value of y from the following observations if these are already arranged in ascending order. The Median is 63.
20, 24, 42, y , y + 2, 73, 75, 80, 99
Solution:
As the number of observations made is odd, so the median will be the middle term, i.e. y + 2.
Therefore,
y + 2 = 63
y = 63 – 2 = 61
Q.4. While checking the value of 20 observations, it was noted that 125 was wrongly noted as 25 while calculating the mean and then the mean was 60. Find the correct mean.
Solution:
Let y be the sum of observation of 19 (20 – 1) numbers leaving 125.
So, y + 25 = 20 × 60 = 1200 {Mean = (sum of observations/ no. of observations)}
As we know,
x + 25 = 20 × 60 = 1200
Also
x + 125 = 20 × y = 20y
Next, Subtract 125 − 25 = 20y − 1200
20y = 1300
y = 65
Q.5. Find the mode of the following items.
0, 5, 5, 1, 6, 4, 3, 0, 2, 5, 5, 6
Solution: On arranging the items in ascending order, we get:
0, 0, 1, 2, 3, 4, 5, 5, 5, 5, 6, 6
As we can see 5 occurs the maximum number of times.
Therefore, the mode of the given items = 5
Q.6. A student scored the following marks in 6 subjects:
30, 19, 25, 30, 27, 30
Find his modal score.
Solution: If we arrange his marks in ascending order
19, 25, 27, 30, 30, 30
As we can see, 30 occurs a maximum number of times.
Therefore, the modal score of the student = 30
Q.7.The daily minimum steps climbed by a man during a week were as under:
| Monday | Tuesday | Wednesday | Thursday | Friday | Saturday |
| 35 | 30 | 27 | 32 | 23 | 28 |
Find the mean of the steps.
Solution: Number of steps climbed in a week: 35, 30, 27, 32, 23, 28.
So, we get,
Mean = sum of observation (steps) / total no of observations
= (35 + 30 + 27 + 32 + 23 + 28) / 6
= 175/6
= 29.17
Q. 8. If the mean of 4 numbers, 2,6,7 and a is 15 and also the mean of other 5 numbers, 6, 18, 1, a, b is 50. What is the value of b?
Solution:
Mean = sum of observations / no. of observations
15 = (2 + 6 + 7 +a)/4
15 = (15 + a) / 4
15 x 4 = 15 + a
60 – 15 = a
a = 45
Similarly,
Mean = sum of observations / no. of observations
50 = (18 + 6 + 1 +a + b)/5
50 = (18 + 6 + 1 +45 + b)/5
50 = (70 + b)/5
250 = 70 + b
b = 250 – 70 = 180
So, The value of b = 180.
Q.9: If the mean of first n natural numbers is 15, then find n.
Solution:
We know that the sum of first n natural numbers = n(n + 1)/2
Mean of the first n natural numbers = Sum of first n natural numbers/n
= [n(n + 1)/2]/ n
= (n + 1)/2
According to the given,
(n + 1)/2 = 15
n + 1 = 30
n = 29
Q.10: Construct the cumulative frequency distribution of the following distribution :
| Class | 12.5 – 17.5 | 17.5 – 22.5 | 22.5 – 27.5 | 27.5 – 32.5 | 32.5 – 37.5 |
| Frequency | 2 | 22 | 19 | 14 | 13 |
Solution:
The cumulative frequency distribution of the given distribution is given below :
| Class | Frequency | Cumulative frequency |
| 12.5 – 17.5 | 2 | 2 |
| 17.5 – 22.5 | 22 | 24 |
| 22.5 – 27.5 | 19 | 43 |
| 27.5 – 32.5 | 14 | 57 |
| 32.5 – 37.5 | 13 | 70 |
Long Answer Type Questions
Q. 1: Consider the following distribution of daily wages of 50 workers of a factory.
| Daily wages (in Rs.) | 100-120 | 120-140 | 140-160 | 160-180 | 180-200 |
| Number of workers | 12 | 14 | 8 | 6 | 10 |
Find the mean daily wages of the workers of the factory by using an appropriate method.
Solution:
Find the midpoint of the given interval using the formula.
Midpoint (xi) = (upper limit + lower limit)/2
In this case, the value of mid-point (xi) is very large, so let us assume the mean value, A = 150 and class interval is h = 20.
So, ui = (xi – A)/h = ui = (xi – 150)/20
Substitute and find the values as follows:
| Daily wages (Class interval) |
Number of workers frequency (fi) |
Mid-point (xi) | ui = (xi – 150)/20 | fiui |
| 100-120 | 12 | 110 | -2 | -24 |
| 120-140 | 14 | 130 | -1 | -14 |
| 140-160 | 8 | 150 | 0 | 0 |
| 160-180 | 6 | 170 | 1 | 6 |
| 180-200 | 10 | 190 | 2 | 20 |
| Total | Sum fi = 50 | Sum fiui = -12 |
So, the formula to find out the mean is:
Mean = x̄ = A + h (∑fiui /∑fi) =150 + (20 × -12/50) = 150 – 4.8 = 145.20
Therefore, mean daily wage of the workers = Rs. 145.20
Q.2: Thirty women were examined in a hospital by a doctor and the number of heartbeats per minute was recorded and summarised as follows. Find the mean heartbeats per minute for these women, choosing a suitable method.
| Number of heart beats per minute | 65-68 | 68-71 | 71-74 | 74-77 | 77-80 | 80-83 | 83-86 |
| Number of women | 2 | 4 | 3 | 8 | 7 | 4 | 2 |
Solution:
From the given data, let us assume the mean as A = 75.5
xi = (Upper limit + Lower limit)/2
Class size (h) = 3
Now, find the ui and fi ui as follows:
| Class Interval | Number of women (fi) | Mid-point (xi) | ui = (xi – 75.5)/h | fiui |
| 65-68 | 2 | 66.5 | -3 | -6 |
| 68-71 | 4 | 69.5 | -2 | -8 |
| 71-74 | 3 | 72.5 | -1 | -3 |
| 74-77 | 8 | 75.5 | 0 | 0 |
| 77-80 | 7 | 78.5 | 1 | 7 |
| 80-83 | 4 | 81.5 | 2 | 8 |
| 83-86 | 2 | 84.5 | 3 | 6 |
| Sum fi= 30 | Sum fiui = 4 |
Mean = x̄ = A + h∑fiui /∑fi
= 75.5 + 3×(4/30)
75.5 + 4/10
= 75.5 + 0.4
= 75.9
Therefore, the mean heartbeats per minute for these women is 75.9
Q. 3: The following data gives the distribution of the total monthly household expenditure of 200 families of a village. Find the modal monthly expenditure of the families. Also, find the mean monthly expenditure :
| Expenditure | Number of families |
| 1000-1500 | 24 |
| 1500-2000 | 40 |
| 2000-2500 | 33 |
| 2500-3000 | 28 |
| 3000-3500 | 30 |
| 3500-4000 | 22 |
| 4000-4500 | 16 |
| 4500-5000 | 7 |
Solution:
From the given data:
Modal class = 1500-2000
l = 1500
Frequencies:
fm = 40
f1 = 24, f< = 33 and
h = 500
Mode formula:
Substitute the values in the formula, we get;
Mode = 1500 + ((16 x 500)/23)
Mode = 1500+(8000/23) = 1500 + 347.83
Therefore, the modal monthly expenditure of the families= Rupees 1847.83
Calculation for mean:
First find the midpoint using the formula, xi =(upper limit +lower limit)/2
Let us assume a mean, A be 2750
| Class Interval | fi | xi | di = xi – a | ui = di/h | fiui |
| 1000-1500 | 24 | 1250 | -1500 | -3 | -72 |
| 1500-2000 | 40 | 1750 | -1000 | -2 | -80 |
| 2000-2500 | 33 | 2250 | -500 | -1 | -33 |
| 2500-3000 | 28 | 2750 | 0 | 0 | 0 |
| 3000-3500 | 30 | 3250 | 500 | 1 | 30 |
| 3500-4000 | 22 | 3750 | 1000 | 2 | 44 |
| 4000-4500 | 16 | 4250 | 1500 | 3 | 48 |
| 4500-5000 | 7 | 4750 | 2000 | 4 | 28 |
| fi = 200 | fiui = -35 |
The formula to calculate the mean,
Mean = x̄ = a + (∑fiui /∑fi) х h
Substitute the values in the given formula
= 2750 + (-35/200) х 500
= 2750 – 87.50
= 2662.50
So, the mean monthly expenditure of the families = Rupees 2662.50
Q. 4: A student noted the number of cars passing through a spot on a road for 100 periods each of 3 minutes and summarised it in the table given below. Find the mode of the data:
| Number of cars | Frequency |
| 0-10 | 7 |
| 10-20 | 14 |
| 20-30 | 13 |
| 30-40 | 12 |
| 40-50 | 20 |
| 50-60 | 11 |
| 60-70 | 15 |
| 70-80 | 8 |
Solution:
From the given data:
Modal class = 40 – 50, l = 40,
class width (h) = 10, fm = 20, f1 = 12 and f2 = 11
Substitute the values
Mode = 40 + (80/17) = 40 + 4.7 = 44.7
Thus, the mode of the given data is 44.7 cars
Q. 5: An aircraft has 120 passenger seats. The number of seats occupied during 100 flights are given in the following table :
| Number of seats | 100-104 | 104-108 | 108-112 | 112-116 | 116-200 |
| Frequency | 15 | 20 | 32 | 18 | 15 |
Determine the mean number of seats occupied over the flights.
Solution:
| Class Interval | Class Marks (xi) | Frequency (fi) | Deviation (di = xi – a) | fidi |
| 100 – 104 | 102 | 15 | – 8 | – 120 |
| 104 – 108 | 106 | 20 | – 4 | – 80 |
| 108 – 112 | 110 | 32 | 0 | 0 |
| 112 – 116 | 114 | 18 | 4 | 72 |
| 116 – 120 | 118 | 15 | 8 | 120 |
| N = Σfi = 100 | Σfidi = – 8 |
∴ Assumed mean, a = 110
Class width, h = 4
And total observations, N = 100
= 110 + (-8/100)
= 110 – 0.08
= 109.92
But we know that the seats cannot be in decimal.
Therefore, the number of seats = 109 (approx).
Q. 6: A survey regarding the heights (in cm) of 51 girls of Class X of a school was conducted and the following data were obtained:
| Height (in cm) | Number of girls |
| Less than 140 | 4 |
| Less than 145 | 11 |
| Less than 150 | 29 |
| Less than 155 | 40 |
| Less than 160 | 46 |
| Less than 165 | 51 |
Find the median height.
Solution:
To calculate the median height, we need to find the class intervals and their corresponding frequencies.
The given distribution is of the less than type, 140, 145, 150,… ., 165 gives the upper limits of the corresponding class intervals.
So, the classes should be below 140, 140 – 145, 145 – 150,… ., 160 – 165.
Observe that from the given distribution, we find that there are 4 girls with height less than 140, i.e., the frequency of class interval below 140 is 4.
Now, there are 11 girls with heights less than 145 and 4 girls with heights less than 140. Therefore, the number of girls with height in the interval of 140 – 145 is 11 – 4 = 7.
Similarly, the frequency of 145 – 150 is 29 – 11 = 18, for 150 – 155, it is 40 – 29 = 11, and so on. So, our frequency distribution table with the given cumulative frequencies becomes:
| Class intervals | Frequency | Cumulative frequency |
| Below 140 | 4 | 4 |
| 140-145 | 7 | 11 |
| 145-150 | 18 | 29 |
| 150-155 | 11 | 40 |
| 155-160 | 6 | 46 |
| 160-165 | 5 | 51 |
Now n = 51. So, n/2 = 51/2 =25.5
This observation lies in class 145 – 150.
Then, l (the lower limit) = 145,
cf (the cumulative frequency of the class preceding 145 – 150) = 11,
f (the frequency of the median class 145 – 150) = 18,
h (the class size) = 5.
Using the formula,
we have Median
= 145 + 72.5/18 = 149.03.
So, the median height of the girls is 149.03 cm.
This means that the height of about 50% of the girls is less than this height, and 50% are taller than this height.
Q. 7: The lengths of 40 leaves of a plant are measured correct to the nearest millimetre, and the data obtained is represented in the following table :
| Length(in mm) | Number of leaves |
| 118-126 | 3 |
| 127-135 | 5 |
| 136-144 | 9 |
| 145-153 | 12 |
| 154-162 | 5 |
| 163-171 | 4 |
| 172-180 | 2 |
Find the median length of leaves.
(Hint: The data needs to be converted to continuous classes for finding the median since the formula assumes continuous classes. The classes then change to 117.5 – 126.5, 126.5 – 135.5, . . ., 171.5 – 180.5.)
Solution:
Since the data are not continuous reduce 0.5 in the lower limit and add 0.5 in the upper limit.
| Class Interval (CI) | Frequency | Cumulative frequency |
| 117.5-126.5 | 3 | 3 |
| 126.5-135.5 | 5 | 8 |
| 135.5-144.5 | 9 | 17 |
| 144.5-153.5 | 12 | 29 |
| 153.5-162.5 | 5 | 34 |
| 162.5-171.5 | 4 | 38 |
| 171.5-180.5 | 2 | 40 |
From the above tab
n = 40 and n/2 = 20
Median class = 144.5-153.5
then, l = 144.5,
cf = 17, f = 12 & h = 9
=144.5+(9/4)
=146.75 mm
Therefore, the median length of the leaves = 146.75 mm.
Q. 8: If the median of a distribution given below is 28.5 then, find the value of an x &y.
| Class Interval | Frequency |
| 0-10 | 5 |
| 10-20 | x |
| 20-30 | 20 |
| 30-40 | 15 |
| 40-50 | y |
| 50-60 | 5 |
| Total | 60 |
Solution:
From the given data,
n = 60
Median of the given data = 28.5
Where, n/2 = 30
Median class is 20 – 30 with a cumulative frequency = 25 + x
Lower limit of median class = 20,
Cf = 5 + x ,
f = 20 & h = 10
Substitute the values
28.5=20+10(30−5−x)/20)
8.5 =(25-x)/2
17 = 25-x
Therefore, x =8
Now, from cumulative frequency, we can identify the value of x + y as follows:
Since,
60=5+20+15+5+x+y
Now, substitute the value of x, to find y
60 = 5+20+15+5+8+y
y = 60-53
y = 7
Therefore, the value of x = 8 and y = 7
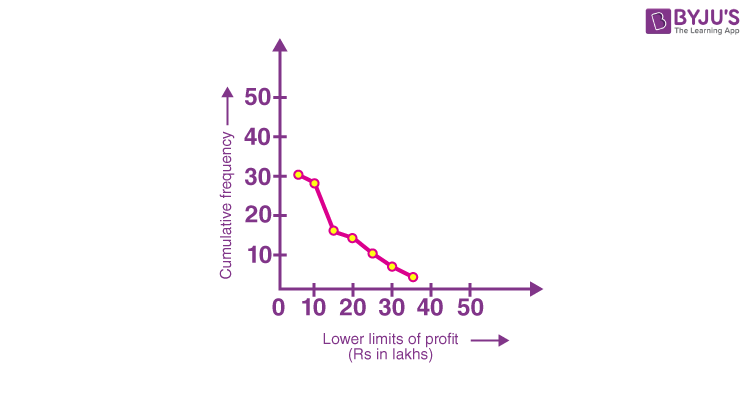
Q. 9: The annual profits earned by 30 shops of a shopping complex in a locality give rise to the following distribution :
| Profit (Rs in lakhs) | Number of shops (frequency) |
| More than or equal to 5 | 30 |
| More than or equal to 10 | 28 |
| More than or equal to 15 | 16 |
| More than or equal to 20 | 14 |
| More than or equal to 25 | 10 |
| More than or equal to 30 | 7 |
| More than or equal to 35 | 3 |
Draw both Ogives for the above data. Hence obtain the median profit.
Solution :
We first draw the coordinate axes, with lower limits of the profit along the horizontal axis, and the cumulative frequency along the vertical axes.
Then, we plot the points (5, 30), (10, 28), (15, 16), (20, 14), (25, 10), (30, 7) and (35, 3). We
join these points with a smooth curve to get the ‘more than’ ogive, as shown in the below figure.
Now, let us obtain the classes, their frequencies and the cumulative frequency from the given table.
| Classes | Number of shops | Cumulative frequency |
| 5-10 | 2 | 2 |
| 10-15 | 12 | 14 |
| 15-20 | 2 | 16 |
| 20-25 | 4 | 20 |
| 25-30 | 3 | 23 |
| 30-35 | 4 | 27 |
| 35-40 | 3 | 30 |
Using these values, we plot the points (10, 2), (15, 14), (20, 16), (25, 20), (30, 23), (35, 27), (40, 30) on the same axes as in the above figure, to get the ‘less than’ ogive, as shown below.
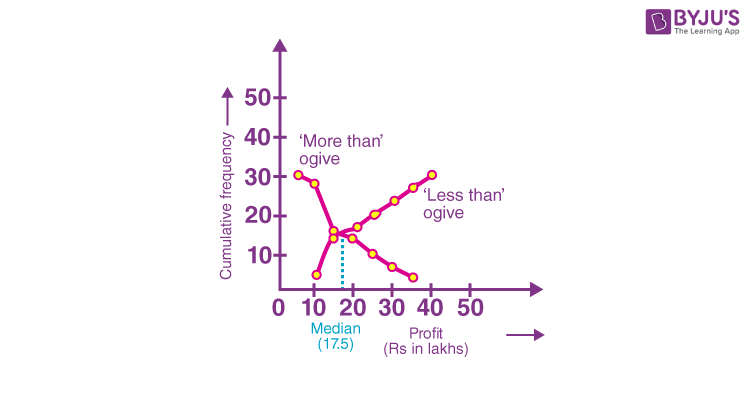
The abscissa of their point of intersection is nearly 17.5, which is the median. This can also be verified by using the formula.
Hence, the median profit (in lakhs) is Rs. 17.5.
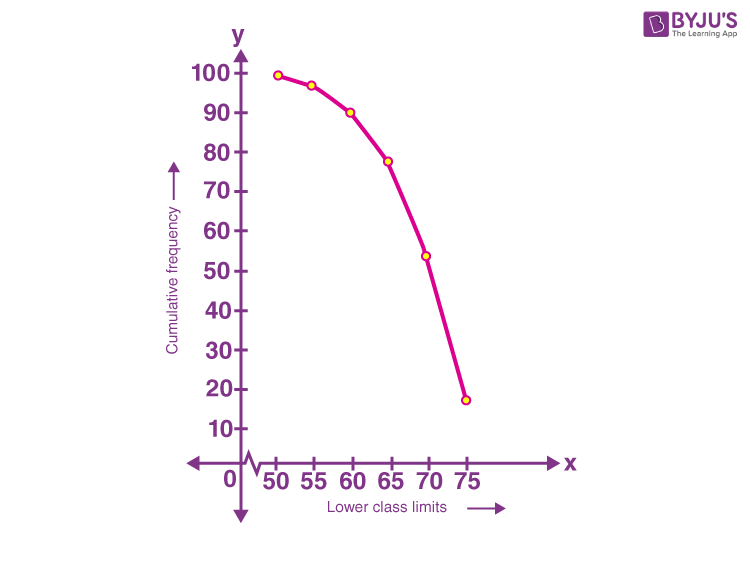
Q. 10: The following tables give the production yield per hectare of wheat of 100 farms of a village.
| Production Yield | 50-55 | 55-60 | 60-65 | 65-70 | 70-75 | 75-80 |
| Number of farms | 2 | 8 | 12 | 24 | 38 | 16 |
Change the distribution to a more than type distribution and draw its ogive.
Solution:
Converting the given distribution to a more than type distribution, we get
| Production Yield (kg/ha) | Number of farms |
| More than or equal to 50 | 100 |
| More than or equal to 55 | 100-2 = 98 |
| More than or equal to 60 | 98-8= 90 |
| More than or equal to 65 | 90-12=78 |
| More than or equal to 70 | 78-24=54 |
| More than or equal to 75 | 54-38 =16 |
From the table obtained draw the ogive by plotting the corresponding points where the upper limits in x-axis and the frequencies obtained in the y-axis are (50, 100), (55, 98), (60, 90), (65, 78), (70, 54) and (75, 16) on this graph paper.
The graph obtained is known as more than type ogive curve.
Practice Questions for Class 10 Maths Chapter 14 Statistics
- The frequency distribution table of agricultural holdings in a village is given below :
Area of land (in hectares) 1-3 3-5 5-7 7-9 9-11 11-13 Number of families 20 45 80 55 40 12 Find the modal agricultural holdings of the village.
- The maximum bowling speeds, in km per hour, of 33 players at a cricket coaching centre are given as follows :
Speed (km/hr) 85-100 100-115 115-130 130-145 Number of players 11 9 8 5 Calculate the median bowling speed.
- The following distribution shows the daily pocket allowance of children of a locality. The mean pocket allowance is Rs 18. Find the missing frequency f.
Daily Pocket Allowance(in c) 11-13 13-15 15-17 17-19 19-21 21-23 23-35 Number of children 7 6 9 13 f 5 4 - Consider the data :
Class65-8585-105105-125125-145145-165165-185185-205Frequency4513201474
(1) The difference of the upper limit of the median class and the lower limit of the modal class is
(A) 0 (B) 19 (C) 20 (D) 38
(2) In the formula x = a + h(fiui/fi), for finding the mean of grouped frequency distribution, ui =
(A) (xi+a)/h
(B) h (xi – a)
(C) (xi –a)/h
(D) (a – xi)/h - In a continuous frequency distribution, the median of the data is 21. If each observation is increased by 5, then find the new median.
- The average score of boys in the examination of a school is 71 and that of the girls is 73. The average score of the school in the examination is 71.8. Find the ratio of the number of boys to the number of girls who appeared in the examination.
The Important Questions & Answers For Class 10 Maths Chapter 14 Statistics must have helped students in their Class 10 Maths exam preparation. They must keep practising the questions and stay tuned to BYJU’S for the latest update on CBSE/ICSE/State Board/Competitive Exams.
BYJUS IS BEST FOR STUDENTS I AM VERY LUCKY TO BE PART OF BYJUS
THANKS TO BYJUS