To sketch the trigonometry graphs of the functions – Sine, Cosine and Tangent, we need to know the period, phase, amplitude, maximum and minimum turning points. These graphs are used in many areas of engineering and science. Few of the examples are the growth of animals and plants, engines and waves, etc. Also, we have graphs for all the trigonometric functions.
The graphical representation of sine, cosine and tangent functions are explained here briefly with the help of the corresponding graph. Students can learn how to graph a trigonometric function here along with practice questions based on it.
Graphs of Trigonometric Functions
Sine, Cosine and tangent are the three important trigonometry ratios, based on which functions are defined. Below are the graphs of the three trigonometry functions sin x, cos x, and tan x. In these trigonometry graphs, x-axis values of the angles are in radians, and on the y-axis, its f(x) is taken, the value of the function at each given angle.
Sin Graph

- y = sin x
- The roots or zeros of y = sin x is at the multiples of π
- The sin graph passes the x-axis as sin x = 0 there
- Period of the sine function is 2π
- The height of the curve at each point is equal to the line value of sine
| Max value of Graph | Min value of the graph |
| 1 at π/2 | -1 at (3π/2) |
Cos Graph
- y = cos x
- sin (x + π/2 ) = cos x
- y = cos x graph is the graph we get after shifting y = sin x to π/2 units to the left
- Period of the cosine function is 2π
| Max value of Graph | Min value of the graph |
| 1 at 0, 4π | -1 at 2π |

There are a few similarities between the sine and cosine graphs, They are:
- Both have the same curve which is shifted along the x-axis
- Both have an amplitude of 1
- Have a period of 360° or 2π radians
The combined graph of sine and cosine function can be represented as follows.

Tan Graph
The tan function is completely different from sin and cos function. The function here goes between negative and positive infinity, crossing through 0 over a period of π radian.
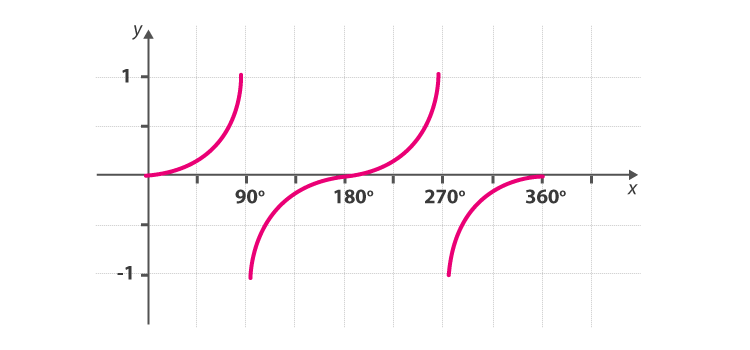
- y = tan x
- The tangent graph has an undefined amplitude as the curve tends to infinity
- It also has a period of 180°, i.e. π
| Learn more on Trigonometry | |
| Trigonometry | Trigonometric Ratios |
| Trigonometric Identities | Trigonometric Functions Calculator |
Graphs of Trigonometric Functions
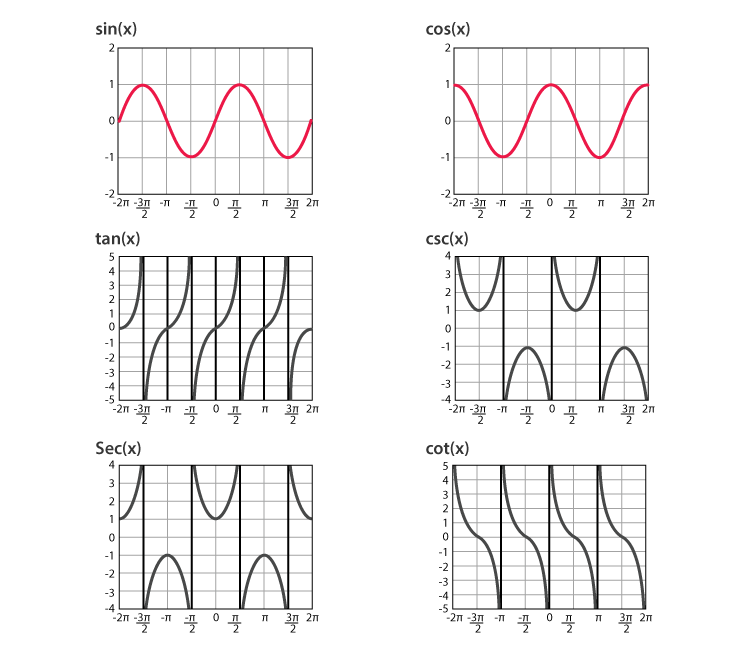
The six trigonometric functions are:
- Sine
- Cosine
- Tangent
- Cosecant
- Secant
- Cotangent
Trigonometric graphs for these Trigonometry functions can be drawn if you know the following:
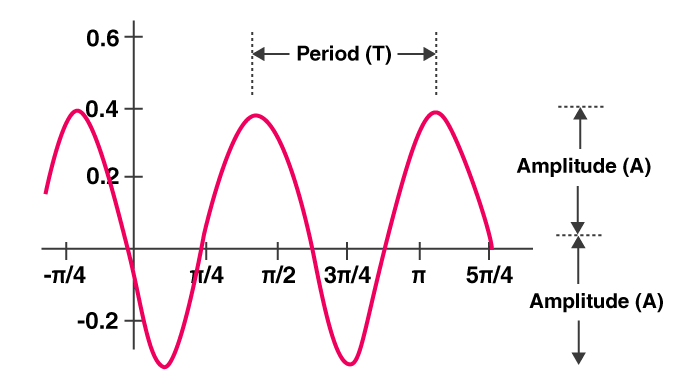
Amplitude
- It is the absolute value of any number multiplied with it on the trigonometric function.
- The height from the centre line to the peak (or trough) is called amplitude.
- You can also measure the height from highest to lowest points and then dividing it by 2.
- It basically tells how tall or short the curve is.
- Also, notice that the function is in usual orientation or upside down depending on the minus or plus sign of the amplitude value.
Period
The Period goes from any point (one peak) to the next matching point.
The graphical representation of period and amplitude of a function is given below.
Phase
How far the function is shifted from the usual position horizontally is called a Phase.
- Max and min turning points.
The above terms are also important to use the graph of trigonometry formulas.
How to Draw the Graph of a Trigonometric Function?
Different methods can be used to draw the graph of a trigonometric function. The detailed explanation of one of the efficient methods is given below.
While drawing a graph of the sine function, convert the given function to the general form as a sin (bx – c) + d in order to find the different parameters such as amplitude, phase shift, vertical shift and period.
Where,
|a| = Amplitude
2π/|b| = Period
c/b = Phase shift
d = Vertical shift
Similarly, for the cosine function we can use the formula a cos (bx – c) + d.
Thus, the graphs of all the six trigonometric functions are as shown in the below figure.
Video Lesson
Maximum and Minimum Value of Trigonometric Functions

Graphing Trig Functions Practice
Let’s practice what we learned in the above paragraphs with few of trigonometry functions graphing questions.
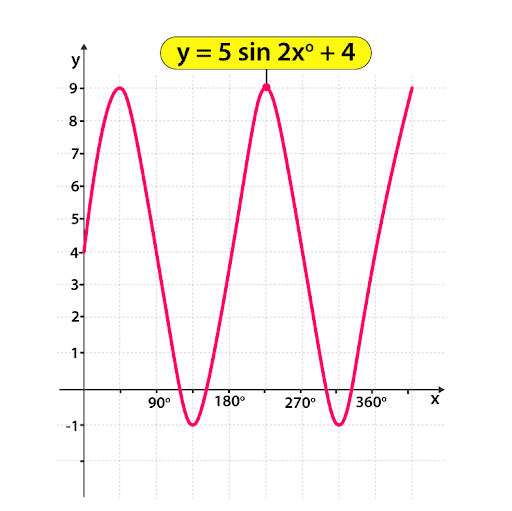
1) Sketch the graph of y = 5 sin 2x° + 4
- Amplitude = 5, so the distance between the max and min value is 10.
- Number of waves = 2 (Each wave has a period of 360° ÷ 2 = 180°)
- moved up by 4
- max turning point when (5 × 1)+ 4 = 9 and min turning point when (5 × -1) + 4 = -1
- Period = 2π/2 = π
- The graph looks like:
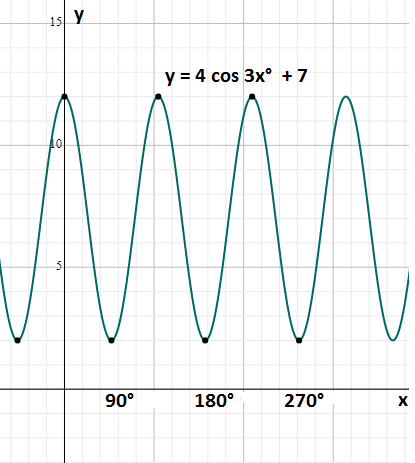
2) Sketch the graph of y = 4 cos 3x° + 7
- Amplitude = 4, so the distance between the max and min value is 8.
- Number of waves = 2 (Each wave has a period of 360° ÷ 2 = 180°)
- the vertical shift is 7
- max turning point when (4 × 1)+ 7 = 11 and min turning point when (4 × -1) + 7 = 3
- Period = 2π/3
- The graph looks like:
To learn more about Trigonometry and related concepts, Register at BYJU’S.

Put your understanding of this concept to test by answering a few MCQs. Click ‘Start Quiz’ to begin!
Select the correct answer and click on the “Finish” button
Check your score and answers at the end of the quiz
Visit BYJU’S for all Maths related queries and study materials
Your result is as below
Your doing a great work to students