Correlation refers to a process for establishing the relationships between two variables. You learned a way to get a general idea about whether or not two variables are related, is to plot them on a “scatter plot”. While there are many measures of association for variables which are measured at the ordinal or higher level of measurement, correlation is the most commonly used approach.
Table of contents:
Correlation in Statistics
This section shows how to calculate and interpret correlation coefficients for ordinal and interval level scales. Methods of correlation summarize the relationship between two variables in a single number called the correlation coefficient. The correlation coefficient is usually represented using the symbol r, and it ranges from -1 to +1.
A correlation coefficient quite close to 0, but either positive or negative, implies little or no relationship between the two variables. A correlation coefficient close to plus 1 means a positive relationship between the two variables, with increases in one of the variables being associated with increases in the other variable.
A correlation coefficient close to -1 indicates a negative relationship between two variables, with an increase in one of the variables being associated with a decrease in the other variable. A correlation coefficient can be produced for ordinal, interval or ratio level variables, but has little meaning for variables which are measured on a scale which is no more than nominal.
For ordinal scales, the correlation coefficient can be calculated by using Spearman’s rho. For interval or ratio level scales, the most commonly used correlation coefficient is Pearson’s r, ordinarily referred to as simply the correlation coefficient.
Also, read: Correlation and Regression
What Does Correlation Measure?
In statistics, Correlation studies and measures the direction and extent of relationship among variables, so the correlation measures co-variation, not causation. Therefore, we should never interpret correlation as implying cause and effect relation. For example, there exists a correlation between two variables X and Y, which means the value of one variable is found to change in one direction, the value of the other variable is found to change either in the same direction (i.e. positive change) or in the opposite direction (i.e. negative change). Furthermore, if the correlation exists, it is linear, i.e. we can represent the relative movement of the two variables by drawing a straight line on graph paper.
Correlation Coefficient
The correlation coefficient, r, is a summary measure that describes the extent of the statistical relationship between two interval or ratio level variables. The correlation coefficient is scaled so that it is always between -1 and +1. When r is close to 0 this means that there is little relationship between the variables and the farther away from 0 r is, in either the positive or negative direction, the greater the relationship between the two variables.
The two variables are often given the symbols X and Y. In order to illustrate how the two variables are related, the values of X and Y are pictured by drawing the scatter diagram, graphing combinations of the two variables. The scatter diagram is given first, and then the method of determining Pearson’s r is presented. From the following examples, relatively small sample sizes are given. Later, data from larger samples are given.
Scatter Diagram
A scatter diagram is a diagram that shows the values of two variables X and Y, along with the way in which these two variables relate to each other. The values of variable X are given along the horizontal axis, with the values of the variable Y given on the vertical axis.
Later, when the regression model is used, one of the variables is defined as an independent variable, and the other is defined as a dependent variable. In regression, the independent variable X is considered to have some effect or influence on the dependent variable Y. Correlation methods are symmetric with respect to the two variables, with no indication of causation or direction of influence being part of the statistical consideration. A scatter diagram is given in the following example. The same example is later used to determine the correlation coefficient.
Types of Correlation
The scatter plot explains the correlation between the two attributes or variables. It represents how closely the two variables are connected. There can be three such situations to see the relation between the two variables –
- Positive Correlation – when the values of the two variables move in the same direction so that an increase/decrease in the value of one variable is followed by an increase/decrease in the value of the other variable.
- Negative Correlation – when the values of the two variables move in the opposite direction so that an increase/decrease in the value of one variable is followed by decrease/increase in the value of the other variable.
- No Correlation – when there is no linear dependence or no relation between the two variables.

Correlation Formula
Correlation shows the relation between two variables. Correlation coefficient shows the measure of correlation. To compare two datasets, we use the correlation formulas.
Pearson Correlation Coefficient Formula
The most common formula is the Pearson Correlation coefficient used for linear dependency between the data sets. The value of the coefficient lies between -1 to +1. When the coefficient comes down to zero, then the data is considered as not related. While, if we get the value of +1, then the data are positively correlated, and -1 has a negative correlation.
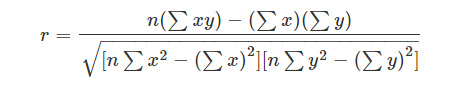
Where n = Quantity of Information
Σx = Total of the First Variable Value
Σy = Total of the Second Variable Value
Σxy = Sum of the Product of first & Second Value
Σx2 = Sum of the Squares of the First Value
Σy2 = Sum of the Squares of the Second Value
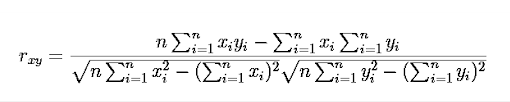
Linear Correlation Coefficient Formula
The formula for the linear correlation coefficient is given by;
Sample Correlation Coefficient Formula
The formula is given by:
rxy = Sxy/SxSy
Where Sx and Sy are the sample standard deviations, and Sxy is the sample covariance.
Population Correlation Coefficient Formula
The population correlation coefficient uses σx and σy as the population standard deviations and σxy as the population covariance.
rxy = σxy/σxσy
Correlation Example
Years of Education and Age of Entry to Labour Force Table.1 gives the number of years of formal education (X) and the age of entry into the labour force (Y ), for 12 males from the Regina Labour Force Survey. Both variables are measured in years, a ratio level of measurement and the highest level of measurement. All of the males are aged close to 30, so that most of these males are likely to have completed their formal education.
| Respondent Number | Years of Education, X | Age of Entry into Labour Force, Y |
| 1 | 10 | 16 |
| 2 | 12 | 17 |
| 3 | 15 | 18 |
| 4 | 8 | 15 |
| 5 | 20 | 18 |
| 6 | 17 | 22 |
| 7 | 12 | 19 |
| 8 | 15 | 22 |
| 9 | 12 | 18 |
| 10 | 10 | 15 |
| 11 | 8 | 18 |
| 12 | 10 | 16 |
Table 1. Years of Education and Age of Entry into Labour Force for 12 Regina Males
Since most males enter the labour force soon after they leave formal schooling, a close relationship between these two variables is expected. By looking through the table, it can be seen that those respondents who obtained more years of schooling generally entered the labour force at an older age. The mean years of schooling are x̄ = 12.4 years and the mean age of entry into the labour force is ȳ= 17.8, a difference of 5.4 years.

This difference roughly reflects the age of entry into formal schooling, that is, age five or six. It can be seen through that the relationship between years of schooling and age of entry into the labour force is not perfect. Respondent 11, for example, has only 8 years of schooling but did not enter the labour force until the age of 18. In contrast, respondent 5 has 20 years of schooling but entered the labour force at the age of 18. The scatter diagram provides a quick way of examining the relationship between X and Y.
To get more information about correlation and related concepts, download BYJU’S – The Learning App today!
Frequently Asked Questions on Correlation – FAQs
What is a correlation in statistics?
What is a correlation of 1?
A correlation of -1 shows a perfect negative correlation, which means as one variable goes down, the other goes up.
What does a correlation of 0.45 mean?
What are the 4 types of correlation?
Pearson Correlation Coefficient
Linear Correlation Coefficient
Sample Correlation Coefficient
Population Correlation Coefficient
the content is very organized and easy to understand
thank you so much ☻