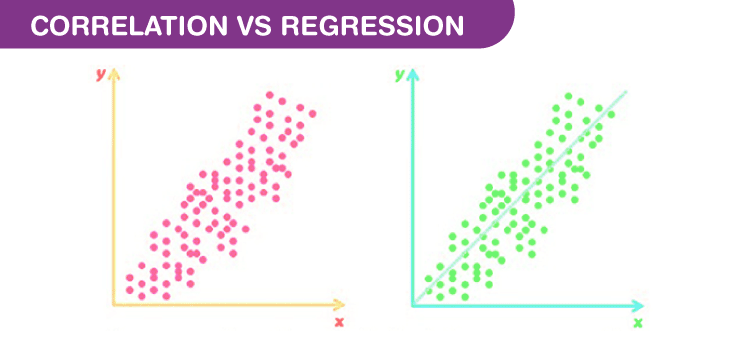
Correlation Analysis
Correlation analysis is applied in quantifying the association between two continuous variables, for example, an dependent and independent variable or among two independent variables.
Regression Analysis
Regression analysis refers to assessing the relationship between the outcome variable and one or more variables. The outcome variable is known as the dependent or response variable and the risk elements, and co-founders are known as predictors or independent variables. The dependent variable is shown by “y” and independent variables are shown by “x” in regression analysis.
The sample of a correlation coefficient is estimated in the correlation analysis. It ranges between -1 and +1, denoted by r and quantifies the strength and direction of the linear association among two variables. The correlation among two variables can either be positive, i.e. a higher level of one variable is related to a higher level of another or negative, i.e. a higher level of one variable is related to a lower level of the other.
The sign of the coefficient of correlation shows the direction of the association. The magnitude of the coefficient shows the strength of the association.
For example, a correlation of r = 0.8 indicates a positive and strong association among two variables, while a correlation of r = -0.3 shows a negative and weak association. A correlation near to zero shows the non-existence of linear association among two continuous variables.
Linear Regression
Linear regression is a linear approach to modelling the relationship between the scalar components and one or more independent variables. If the regression has one independent variable, then it is known as a simple linear regression. If it has more than one independent variable, then it is known as multiple linear regression. Linear regression only focuses on the conditional probability distribution of the given values rather than the joint probability distribution. In general, all the real world regressions models involve multiple predictors. So, the term linear regression often describes multivariate linear regression.
Correlation and Regression Differences
There are some differences between Correlation and regression.
- Correlation shows the quantity of the degree to which two variables are associated. It does not fix a line through the data points. You compute a correlation that shows how much one variable changes when the other remains constant. When r is 0.0, the relationship does not exist. When r is positive, one variable goes high as the other goes up. When r is negative, one variable goes high as the other goes down.
- Linear regression finds the best line that predicts y from x, but Correlation does not fit a line.
- Correlation is used when you measure both variables, while linear regression is mostly applied when x is a variable that is manipulated.
Comparison Between Correlation and Regression
| Basis | Correlation | Regression |
| Meaning | A statistical measure that defines co-relationship or association of two variables. | Describes how an independent variable is associated with the dependent variable. |
| Dependent and Independent variables | No difference | Both variables are different. |
| Usage | To describe a linear relationship between two variables. | To fit the best line and estimate one variable based on another variable. |
| Objective | To find a value expressing the relationship between variables. | To estimate values of a random variable based on the values of a fixed variable. |
Correlation and Regression Statistics
The degree of association is measured by “r” after its originator and a measure of linear association. Other complicated measures are used if a curved line is needed to represent the relationship.
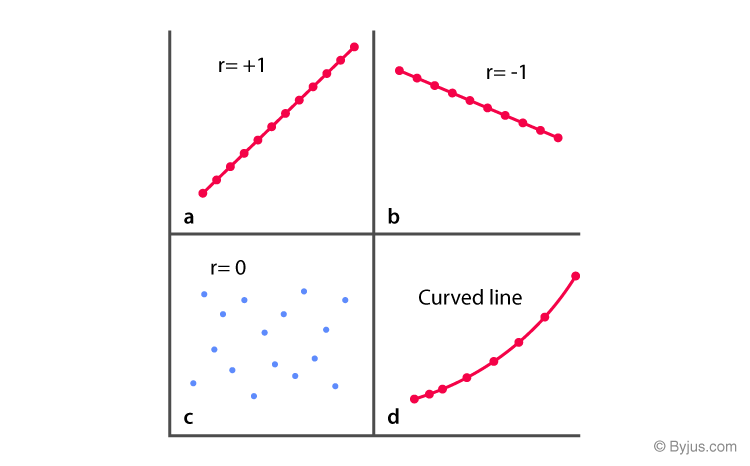
The above graph represents the correlation.
The coefficient of correlation is measured on a scale that varies from +1 to -1 through 0. The complete correlation among two variables is represented by either +1 or -1. The correlation is positive when one variable increases and so does the other; while it is negative when one decreases as the other increases. The absence of correlation is described by 0.
Correlation Coefficient Formula
Let X and Y be the two random variables.
The population correlation coefficient for X and Y is given by the formula:
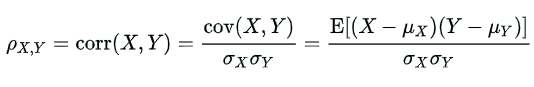
Where,
ρXY = Population correlation coefficient between X and Y
μX = Mean of the variable X
μY = Mean of the variable Y
σX = Standard deviation of X
σY = Standard deviation of Y
E = Expected value operator
Cov = Covariance
The above formulas can also be written as:
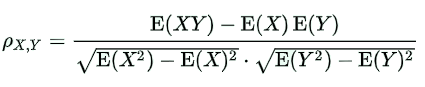
The sample correlation coefficient formula is:
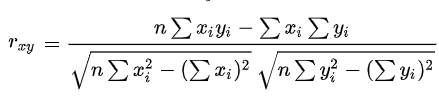
The above formulas are used to find the correlation coefficient for the given data. Based on the value obtained through these formulas, we can determine how strong is the association between two variables.
Simple Linear Regression Equation
As we know, linear regression is used to model the relationship between two variables. Thus, a simple linear regression equation can be written as:
Y = a + bX
Where,
Y = Dependent variable
X = Independent variable
a = [(∑y)(∑x2) – (∑x)(∑xy)]/ [n(∑x2) – (∑x)2]
b = [n(∑xy) – (∑x)(∑y)]/ [n(∑x2) – (∑x)2]
Regression Coefficient
In the linear regression line, the equation is given by:
Y = b0 + b1X
Here b0 is a constant and b1 is the regression coefficient.
The formula for the regression coefficient is given below.
b1 = ∑[(xi – x)(yi – y)]/ ∑[(xi – x)2]
The observed data sets are given by xi and yi. x and y are the mean value of the respective variables.
We know that there are two regression equations and two coefficients of regression.
The regression coefficient of y and x formula is:
byx = r(σy/σx)
The regression coefficient of x on y formula is:
bxy = r(σx/σy)
Where,
σx = Standard deviation of x
σy = Standard deviation of y
Some of the properties of a regression coefficient are listed below:
- The regression coefficient is denoted by b.
- The regression coefficient of y on x can be represented as byx. The regression coefficient of x on y can be represented as bxy. If one of these regression coefficients is greater than 1, then the other will be less than 1.
- They are not independent of the change of scale. They will change in the regression coefficient if x and y are multiplied by any constant.
- The arithmetic mean of both regression coefficients is greater than or equal to the coefficient of correlation.
- The geometric mean between the two regression coefficients is equal to the correlation coefficient.
If bxy is positive, then byx is also positive and vice versa.
To know more about Correlation and regression formulas, the difference between correlation and regression with examples, you can visit us at BYJU’S – The Learning App.
Best of best and scientific information!
Hi! I’m using this helpful website, but I see there is no specific author or published date for me to cite. Please provide for future use. Thanks!