Graphing Linear Equations (Definition, Examples) - BYJUS

Graphing Linear Equations

A linear equation is one in which the highest exponent of a variable is 1. A linear equation is represented by a straight line on the coordinate plane. In this article, we will learn about linear equations and the method used to graph them....Read MoreRead Less

Select your child's grade in school:

Linear Equation

An equation with the highest exponent of 1 is said to be a linear equation. The graph of a linear equation is always a straight line.

We have to note that a linear equation in one variable is known as a one-variable linear equation


The standard form of a one variable linear equation is \(Ax~+~B=0\), where x is the variable, A is the coefficient of \(x\), and \(B\) is the constant. Here, ‘\(A\)’ can not be zero.

For example: \(3x~+~8=0\)


A linear equation with two variables is a two-variable linear equation

The standard form of a two variable linear equation is \(Ax~+~By~+~C=0\) where x and y are the variables, \(A\) is the coefficient of \(x,~B\) is the coefficient of, \(y\) and \(C\) is the constant.


For example: \(3x~-~2y~+~5=0\)

What is an Ordered pair?

An ordered pair is made up of the \(x\)(abscissa) and \(y\) (ordinate) coordinates, with two values written in a specific order within parentheses, \((x,~y)\), where x represents the distance from the origin along the \(x\)-axis, and \(y\) states the distance from the origin along the \(y\)-axis.


new1

Graphing Linear Equations

The graph of a two-variable linear equation is a straight line. The graph of a linear equation can be drawn with the help of any two points \((x_1,~y_1)\) and \((x_2,~y_2)\). The following steps are to be followed to draw the graph:


Step 1: Make a table of values by putting values of \(x\) and getting the values of \(y\).


Step 2: Plot all the ordered pairs on the coordinate plane.


Step 3: Draw a line passing through all the ordered pairs.


For example: Plot a graph for \(3x~-~4y=12\).

Here, \(3x~-~4y=12\)


new2

Graphing a Horizontal Line

The standard form of a horizontal line is \(y~=~b\) and the line passes through the point \((0,~b)\). The horizontal line is parallel to the \(x\)axis.


new3

Graphing a Vertical Line

The standard form of a vertical line is \(x=a\) and the line passes through the point \((a,~0)\). The vertical line is parallel to the \(y\)axis.


new4

Solved Examples

Example 1: Graph \(y=3x~-~2\).


Solution:

Step 1: Make a table of values.

x

\(y=3x~-~2\)

y

\((x,~y)\)

-1

\(y=3(- 1)~-~2\)

-5

(-1, -5)

0

\(y=3(0)~-~2\)

-2

(0, -2)

1

\(y=3(1)~-~2\)

1

(1, 1)

2

\(y=3(2)~-~2\)

4

(2, 4)

Step 2: Plot the ordered pairs.


Step 3: Draw the line through the points. 

new5


Example 2: Graph \(y=5\)


Solution:

The graph of \(y=5\) is a horizontal line passing through (0, 5). Draw a horizontal line that passes through this point.


new6


Example 3: Graph \(x=-~2\).


Solution:

The graph of\(x=-~2\) is a vertical line passing through (-2, 0). Draw a vertical line that passes through this point.


new7


Example 4: The amount \(y\) (in dollars) of money in Sam’s saving accounts after \(x\) months is represented by the equation \(y=5x~+~200\). Draw the graph for the equation. In how many months Sam will have $300 as a savings in his account?


Solution:

Step 1: Make a table of values.


x

\(y=5x~+~200\)

y

\((x,~y)\)

1

\(y=5(1)~+~200\)

205

(1, 205)

2

\(y=5(2)~+~200\)

210

(2, 210)

3

\(y=5(3)~+~200\)

215

(3, 215)

4

\(y=5(4)~+~200\)

220

(4, 220)

Step 2: Plot the ordered pairs.


Step 3: Draw the line through the points. 


new8


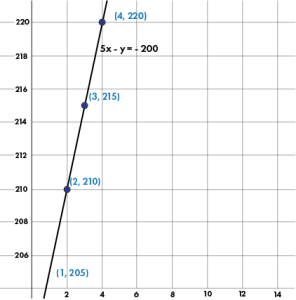
The total amount in the savings account is $300. The number of months in which the account has been saved by solving the equation after putting \(y=300\)


\(y=5x~+~200\)          Writing Equation


\(300=5x~+~200\)      Substitute


\(x=20\)                      Simplify


Sam will take 20 months to save $300.

Frequently Asked Questions

A linear equation is one in which the highest exponent of a variable is 1. Worksheets allow your child to see their processes and determine where they might be making conceptual or computational mistakes.

The equation whose highest exponent is greater than 1 is known as a non-linear equation.

A linear equation is represented by a straight line on a graph.

A solution is a value or a set of values when substituted for the unknown that makes the equation true.