What is Dispersion in Statistics?
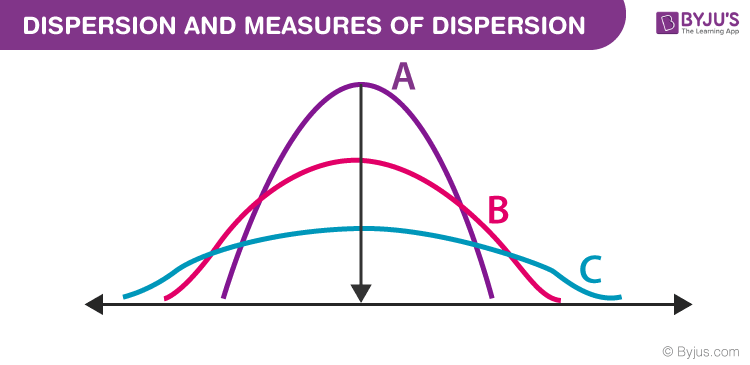
Dispersion is the state of getting dispersed or spread. Statistical dispersion means the extent to which numerical data is likely to vary about an average value. In other words, dispersion helps to understand the distribution of the data.
Measures of Dispersion
In statistics, the measures of dispersion help to interpret the variability of data i.e. to know how much homogenous or heterogeneous the data is. In simple terms, it shows how squeezed or scattered the variable is.
Types of Measures of Dispersion
There are two main types of dispersion methods in statistics which are:
- Absolute Measure of Dispersion
- Relative Measure of Dispersion
Absolute Measure of Dispersion
An absolute measure of dispersion contains the same unit as the original data set. The absolute dispersion method expresses the variations in terms of the average of deviations of observations like standard or means deviations. It includes range, standard deviation, quartile deviation, etc.
The types of absolute measures of dispersion are:
- Range: It is simply the difference between the maximum value and the minimum value given in a data set. Example: 1, 3,5, 6, 7 => Range = 7 -1= 6
- Variance: Deduct the mean from each data in the set, square each of them and add each square and finally divide them by the total no of values in the data set to get the variance. Variance (σ2) = ∑(X−μ)2/N
- Standard Deviation: The square root of the variance is known as the standard deviation i.e. S.D. = √σ.
- Quartiles and Quartile Deviation: The quartiles are values that divide a list of numbers into quarters. The quartile deviation is half of the distance between the third and the first quartile.
- Mean and Mean Deviation: The average of numbers is known as the mean and the arithmetic mean of the absolute deviations of the observations from a measure of central tendency is known as the mean deviation (also called mean absolute deviation).
Also, read:
Relative Measure of Dispersion
The relative measures of dispersion are used to compare the distribution of two or more data sets. This measure compares values without units. Common relative dispersion methods include:
- Co-efficient of Range
- Co-efficient of Variation
- Co-efficient of Standard Deviation
- Co-efficient of Quartile Deviation
- Co-efficient of Mean Deviation
Co-efficient of Dispersion
The coefficients of dispersion are calculated (along with the measure of dispersion) when two series are compared, that differ widely in their averages. The dispersion coefficient is also used when two series with different measurement units are compared. It is denoted as C.D.
The common coefficients of dispersion are:
| C.D. in terms of | Coefficient of dispersion |
|---|---|
| Range | C.D. = (Xmax – Xmin) ⁄ (Xmax + Xmin) |
| Quartile Deviation | C.D. = (Q3 – Q1) ⁄ (Q3 + Q1) |
| Standard Deviation (S.D.) | C.D. = S.D. ⁄ Mean |
| Mean Deviation | C.D. = Mean deviation/Average |
Measures of Dispersion Formulas
The most important formulas for the different dispersion methods are:
| Arithmetic Mean Formula | Quartile Formula |
| Standard Deviation Formula | Variance Formula |
| Interquartile Range Formula | All Statistics Formulas |
Solved Examples
Example 1: Find the Variance and Standard Deviation of the Following Numbers: 1, 3, 5, 5, 6, 7, 9, 10.
Solution:
The mean = (1+ 3+ 5+ 5+ 6+ 7+ 9+ 10)/8 = 46/ 8 = 5.75
Step 1: Subtract the mean value from individual value
(1 – 5.75), (3 – 5.75), (5 – 5.75), (5 – 5.75), (6 – 5.75), (7 – 5.75), (9 – 5.75), (10 – 5.75)
= -4.75, -2.75, -0.75, -0.75, 0.25, 1.25, 3.25, 4.25
Step 2: Squaring the above values we get, 22.563, 7.563, 0.563, 0.563, 0.063, 1.563, 10.563, 18.063
Step 3: 22.563 + 7.563 + 0.563 + 0.563 + 0.063 + 1.563 + 10.563 + 18.063
= 61.504
Step 4: n = 8, therefore variance (σ2) = 61.504/ 8 = 7.69
Now, Standard deviation (σ) = 2.77
Example 2: Calculate the range and coefficient of range for the following data values.
45, 55, 63, 76, 67, 84, 75, 48, 62, 65
Solution:
Let Xi values be: 45, 55, 63, 76, 67, 84, 75, 48, 62, 65
Here,
Maxium value (Xmax) = 84
Minimum or Least value (Xmin) = 45
Range = Maximum value = Minimum value
= 84 – 45
= 39
Coefficient of range = (Xmax – Xmin)/(Xmax + Xmin)
= (84 – 45)/(84 + 45)
= 39/129
= 0.302 (approx)
Practice Problems
- Find the coefficient of standard deviation for the data set: 32, 35, 37, 30, 33, 36, 35 and 37
- The mean and variance of seven observations are 8 and 16, respectively. If five of these are 2, 4, 10, 12 and 14, find the remaining two observations.
- In a town, 25% of the persons earned more than Rs 45,000 whereas 75% earned more than 18,000. Compute the absolute and relative values of dispersion.
Frequently Asked Questions – FAQs
Why Is Dispersion Important in Statistics?
The measures of dispersion are important as it helps in understanding how much data is spread (i.e. its variation) around a central value.
How To Calculate Dispersion?
Dispersion can be calculated using various measures like mean, standard deviation, variance, etc.
What is the Variance of the values 3, 8, 6, 10, 12, 9, 11, 10, 12, 7?
The variance of the following numbers will be 7.36.


best way of learning
Its really a wonderful article which help me a lot and give lot of information at a single page.
wonderful information
article is so informative and easy to understand
It very nice thing to me I have learn alot thing on it
Very useful information and easy to understand