1
Question
A radioactive sample consists of two distinct species having an equal number of atoms initially. The mean lifetime of one species is t and that of the other is 5t. The decay products in both cases are stable. A plot is made of the total number of radioactive nuclei as a function of time. Which of the following figures best represents the form of this plot.
A radioactive sample consists of two distinct species having an equal number of atoms initially. The mean lifetime of one species is t and that of the other is 5t. The decay products in both cases are stable. A plot is made of the total number of radioactive nuclei as a function of time. Which of the following figures best represents the form of this plot.
Open in App
Solution
The correct option is D 
Explanation for the correct option
Option (D)
- If a nucleus spontaneously emits particles or radiation or both, an unstable nucleus arrives at its most stable configuration. The spontaneous disintegration of nuclei, leading to a change in their compositions from an unstable state is referred to as radioactivity.
- If the number of radioactive nuclei present at time t, the relation between them is , where, is the decay constant.
- The negative sign implies that the number of nuclei decreases with time, this condition is appropriate to the graph as shown in option (D). Where the number of radioactive nuclei decreases with time, this is natural.
Explanation for the incorrect options
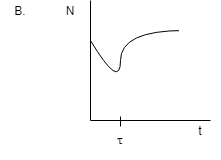
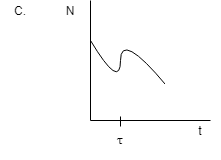
- The all graphs in options (A), (B), and (C), the number of radioactive nuclei sometimes increases and sometimes decreases.
- As we know, , so it is not possible to increase the number of radioactive nuclei with time. So, these options are incorrect.
So, option (D) is correct.
Suggest Corrections
0
Join BYJU'S Learning Program
Join BYJU'S Learning Program


