


1
Question
Construct class intervals and frequencies for the following distribution table. Also draw the less than cumulative frequency curve for the same.

[5 marks]
[5 marks]
Open in App
Solution
The required table is given below:

[2.5 marks]
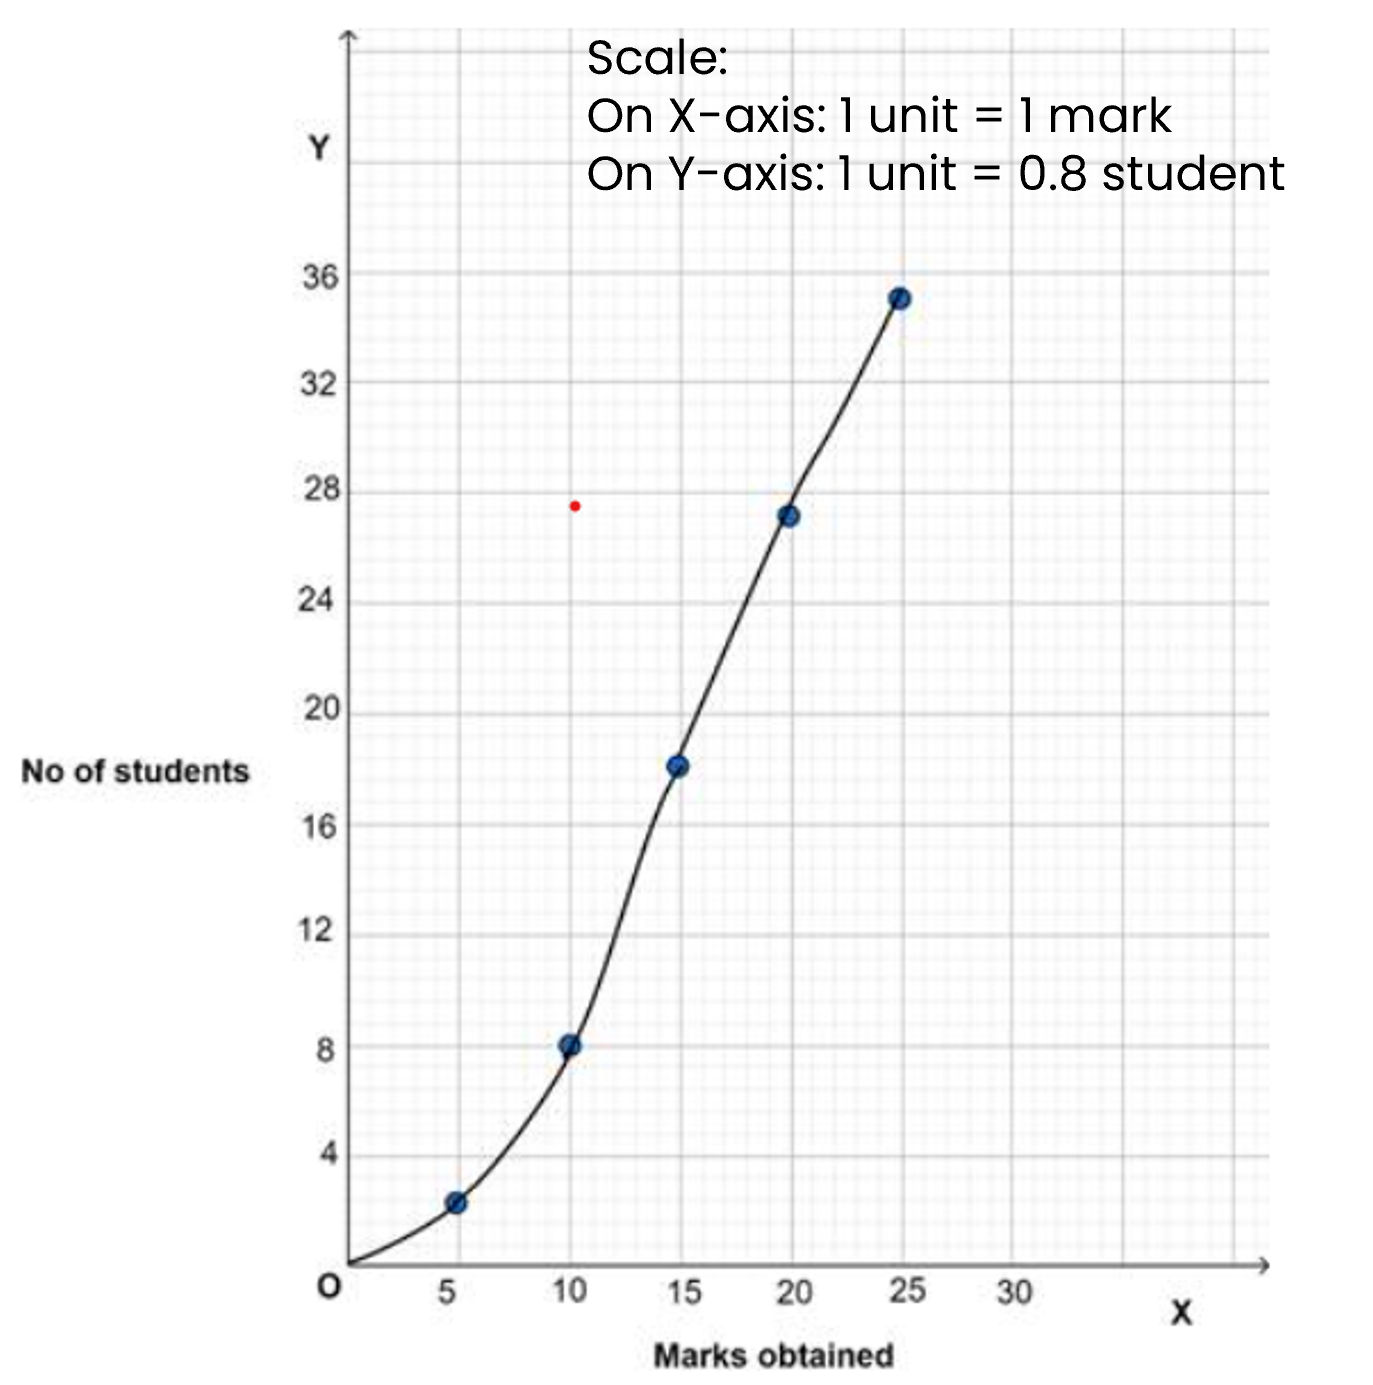
Less than cumulative frequency curve:
Step 1: Mark the upper boundaries of the class intervals along X -axis and their corresponding cumulative frequencies along Y- axis.
Select the scale : X-axis 1 smallest unit = 1 mark
Y-axis 1 smallest unit = 0.8 students
Step 2: Also, plot the lower boundary of the first class (upper boundary of the class previous to first class) interval with cumulative frequency 0.
Step 3: Join these points by a free hand curve to obtain the required curve.
 [2.5 marks]
The required table is given below:
[2.5 marks]
Less than cumulative frequency curve:
Step 1: Mark the upper boundaries of the class intervals along X -axis and their corresponding cumulative frequencies along Y- axis.
Select the scale : X-axis 1 smallest unit = 1 mark
Y-axis 1 smallest unit = 0.8 students
Step 2: Also, plot the lower boundary of the first class (upper boundary of the class previous to first class) interval with cumulative frequency 0.
Step 3: Join these points by a free hand curve to obtain the required curve.
[2.5 marks]Suggest Corrections


14


Similar questions