


1
Question
Draw the Ogive for the following data:
Daily earnings (in ₹)
No. of persons
Draw the Ogive for the following data:
Daily earnings (in ₹) | No. of persons |
Open in App
Solution
Step 1: Make the required cumulative frequency distribution table.
Prepare a cumulative frequency table for more than series.
More than Series
Daily earnings (in ₹)
No. of persons
More than
More than
More than
More than
More than
More than
Step 2: Graph the Ogive Curve.
Draw Ogive by plot the points for more than curve.
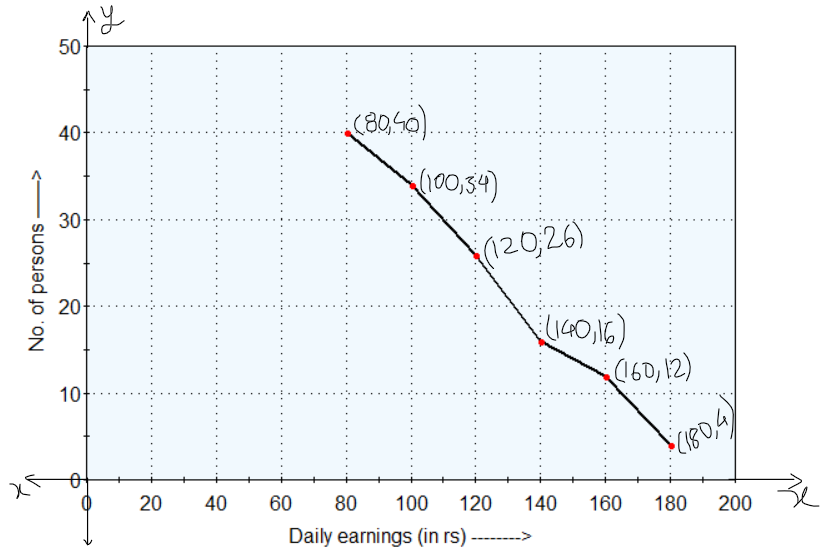
Final Answer:
Finally, we drew the Ogive by using data values of daily earnings and the number of persons.
Step 1: Make the required cumulative frequency distribution table.
Prepare a cumulative frequency table for more than series.
More than Series | |
Daily earnings (in ₹) | No. of persons |
More than | |
More than | |
More than | |
More than | |
More than | |
More than | |
Step 2: Graph the Ogive Curve.
Draw Ogive by plot the points for more than curve.
Final Answer:
Finally, we drew the Ogive by using data values of daily earnings and the number of persons.
Suggest Corrections


0


Similar questions
View More
Join BYJU'S Learning Program


Explore more
Join BYJU'S Learning Program


