1
Question
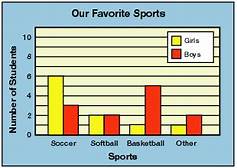
How many children were interviewed for this survey?

How many children were interviewed for this survey?
Open in App
Solution
The correct option is D 22
A bar graph is used to compare items between different groups and track changes over a period of time. It is also a quick and faster way to read and understand data in comparison to reading it as text.
In this case too a quick look at the bar graph tells us that the number of children interviewed for this survey are as follows :
No. of Girls: 6 +2+1+1 = 10
No. of Boys: 3 +2+5+2 = 12
Total : 10 + 12 = 22 children were interviewed for this survey.
A bar graph is used to compare items between different groups and track changes over a period of time. It is also a quick and faster way to read and understand data in comparison to reading it as text.
In this case too a quick look at the bar graph tells us that the number of children interviewed for this survey are as follows :
No. of Boys: 3 +2+5+2 = 12
Total : 10 + 12 = 22 children were interviewed for this survey.
Suggest Corrections
0
View More
Join BYJU'S Learning Program
Join BYJU'S Learning Program


