


1
Question
Show on a graph, the variation of resistivity with temperature for a typical semiconductor.
Show on a graph, the variation of resistivity with temperature for a typical semiconductor.
Open in App
Solution
Resistivity
- Resistivity is the resistance of a conductor of unit length and unit area.
- For a typical semiconductor, the resistivity is defined by the form, , where, n is the number density of electrons, is the relaxation time, m is the mass of the semiconductor, and e is the electronic charge.
- The above formulae show that the resistivity is inversely proportional to the time in the case of a typical semiconductor. i.e, .
- So, as temperature increases, the resistivity of metal increases, giving it a positive temperature coefficient of resistance.
- This is because when temperature rises, electrons in the valence band get enough thermal energy to move to the conduction band.
- As the number of electrons in the conduction band grows, so does conductivity and resistance.
- Taking as a vertical and t as horizontal. We know, is the function of t.
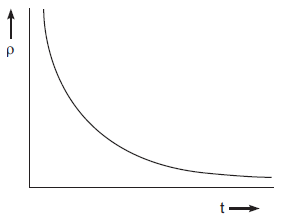
Therefore, the above graph is represented as R vs graph.
Resistivity
- Resistivity is the resistance of a conductor of unit length and unit area.
- For a typical semiconductor, the resistivity is defined by the form, , where, n is the number density of electrons, is the relaxation time, m is the mass of the semiconductor, and e is the electronic charge.
- The above formulae show that the resistivity is inversely proportional to the time in the case of a typical semiconductor. i.e, .
- So, as temperature increases, the resistivity of metal increases, giving it a positive temperature coefficient of resistance.
- This is because when temperature rises, electrons in the valence band get enough thermal energy to move to the conduction band.
- As the number of electrons in the conduction band grows, so does conductivity and resistance.
- Taking as a vertical and t as horizontal. We know, is the function of t.
Therefore, the above graph is represented as R vs graph.
Suggest Corrections


3


Similar questions
View More
Join BYJU'S Learning Program


Explore more
Join BYJU'S Learning Program


