


The length of 40 leaves of a plant are measured correct to one millimeter, and the obtained data is represented in the following table: (i) Draw a histogram to represent the given data. [Hint: First make the class intervals continuous] (ii) Is there any other suitable graphical representation for the same data? (iii) Is it correct to conclude that the maximum number of leaves are 153 mm long? Why?
S.no. Length (in mm) Number of leaves 1. 118 – 126 3 2. 127 – 135 5 3. 136 – 144 9 4. 145 – 153 12 5. 154 – 162 5 6. 163 – 171 4 7. 172 – 180 2
The length of 40 leaves of a plant are measured correct to one millimeter, and the obtained data is represented in the following table: (i) Draw a histogram to represent the given data. [Hint: First make the class intervals continuous] (ii) Is there any other suitable graphical representation for the same data? (iii) Is it correct to conclude that the maximum number of leaves are 153 mm long? Why?
| S.no. | Length (in mm) | Number of leaves |
| 1. | 118 – 126 | 3 |
| 2. | 127 – 135 | 5 |
| 3. | 136 – 144 | 9 |
| 4. | 145 – 153 | 12 |
| 5. | 154 – 162 | 5 |
| 6. | 163 – 171 | 4 |
| 7. | 172 – 180 | 2 |
Step 1. Draw a histogram to represent the given data.
The continuous data is
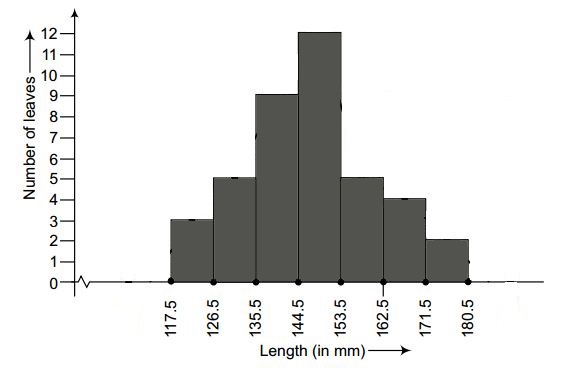
S.no. Length (in mm) Number of leaves 1. 117.5 – 126.5 3 2. 126.5 – 135.5 5 3. 135.5 – 144.5 9 4. 144.5 – 153.5 12 5. 153.5 – 162.5 5 6. 162.5 – 171.5 4 7. 171.5 – 180.5 2
Step 2:The histogram for the given data is as shown below

The data given in the question can also be represented in the form of a frequency polygon also.
Also we cannot conclude that the maximum number of leaves is long because the maximum number of leaves are lying in-between the length of
Hence,
(i) The histogram for the given data is as shown below
(ii) Yes, the data given in the question can also be represented in the form of a frequency polygon.
(iii)No we cannot conclude that the maximum number of leaves is long because the maximum number of leaves are lying in-between the length of
Step 1. Draw a histogram to represent the given data.
The continuous data is
| S.no. | Length (in mm) | Number of leaves |
| 1. | 117.5 – 126.5 | 3 |
| 2. | 126.5 – 135.5 | 5 |
| 3. | 135.5 – 144.5 | 9 |
| 4. | 144.5 – 153.5 | 12 |
| 5. | 153.5 – 162.5 | 5 |
| 6. | 162.5 – 171.5 | 4 |
| 7. | 171.5 – 180.5 | 2 |
Step 2:The histogram for the given data is as shown below
The data given in the question can also be represented in the form of a frequency polygon also.
Also we cannot conclude that the maximum number of leaves is long because the maximum number of leaves are lying in-between the length of
Hence,
(i) The histogram for the given data is as shown below
(ii) Yes, the data given in the question can also be represented in the form of a frequency polygon.
(iii)No we cannot conclude that the maximum number of leaves is long because the maximum number of leaves are lying in-between the length of


