


1
Question
What is histogram?
What is histogram?
Open in App
Solution
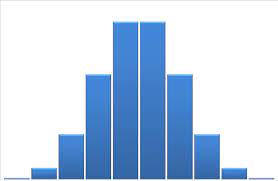
Histogram:
A histogram is a graphical representation of a grouped frequency distribution with continuous classes. It is a graphical display of data using bars of different heights.
Certain condition of histogram are:
- The data should be numerical.
- A histogram is used to check the shape of the data distribution.
- Used to check whether the process changes from one period to another.
- Used to determine whether the output is different when it involves two or more processes.
- Used to analyze whether the given process meets the customer requirements.
Thus, a histogram is a graphical representation of a grouped frequency distribution with continuous classes
Suggest Corrections


1


Join BYJU'S Learning Program


Explore more
Join BYJU'S Learning Program


