


1
Question
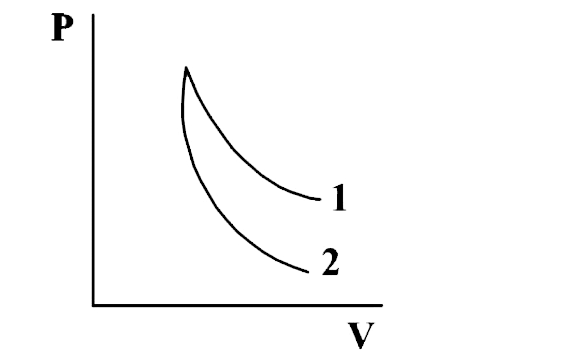
p-V plots for two gases during adiabatic processes are shown in the following figure. Plots 1 and 2 should correspond respectively to
p-V plots for two gases during adiabatic processes are shown in the following figure. Plots 1 and 2 should correspond respectively to
Open in App
Solution
The correct option is B O2 and He
In an adiabatic process,
PVγ = constant
differentiating both side we get, slope of P-V graph,
=dPdV=−γPV
i.e., slope~ proportional to gamma (with negative sign)
which means more the γ more will be the slope.
In (figure) (slope) of curve 2> (slope) of curve 1
γ2>γ1
Greater the value of γ, lesser the work done.
therefore, Plot 1 corresponds to O2 (lesser γ) and Plot 2 corresponds to He(more γ)
Suggest Corrections


0


