In graph theory, a circle graph is the intersection graph of a set of chords of a circle. It is an undirected graph whose vertices can be associated with chords of a circle such that two vertices are adjacent if and only if the corresponding chords cross each other. The circle graph is also called a pie graph and pie chart.
Some important formulas of circle graph are given below:
1. Percentages = (Amount in the Category ⁄ Total) × 100
2. Angle = (Amount in the Category ⁄ Total) × 360°
Solved Examples
Example 1: A fruit basket is filled with 36% Apples, 29% Bananas, 9% Mangoes, 7% Pineapples and 19% Grapes. Prepare a circle graph chart as per the data provided.

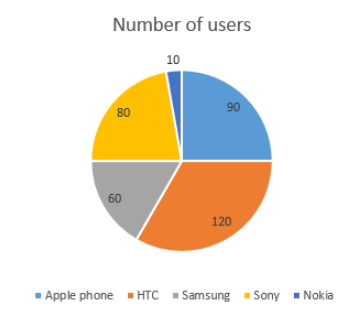
Example 2: The following data gives information about the number of different mobile phones used by the employees of one department in a company. Draw the circle chart for the following data using angle proportions.
| Mobile phone | Number of users |
| Apple phone | 9 |
| HTC | 12 |
| Samsung | 6 |
| Sony | 8 |
| Nokia | 1 |
Solution: Angle = (Amount in the Category ⁄ Total) × 360°
| Mobile phone | Number of users | Angle |
| Apple phone | 9 | (9/36) × 360° = 90° |
| HTC | 12 | (12/36) × 360° = 120° |
| Samsung | 6 | (6/36) × 360° = 60° |
| Sony | 8 | (8/36) × 360° = 80° |
| Nokia | 1 | (1/36) × 360° = 10° |
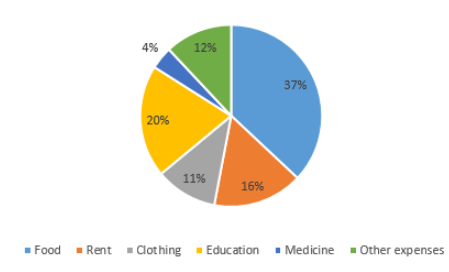
Example 3: The below table shows the percentage of expenses of a person in a month. Draw a circle chart for the data given.
| Category | Percentage of expense |
| Food | 37% |
| Rent | 16% |
| Clothing | 11% |
| Education | 20% |
| Medicine | 4% |
| Other expenses | 12% |
Solution:
Given that,
Food = 37%
Rent = 16%
Clothing = 11%
Education = 20%
Medicine = 4%
Other expenses = 12%
Comments