Important questions with solutions for class 8 Maths chapter 5-Data handling are provided by our subject experts according to the latest CBSE syllabus. These questions have been given in reference with NCERT book for students to help them score good marks in the final board exam.
In this chapter, students will understand the significance of data and its management in small and large industries. Also, they will learn to represent a set of data in a pictorial form or tabular form. Let us see some crucial questions based on it. Also, find the important questions for all the chapters for class 8 Maths at BYJU’S.
Important Questions with Solutions for Class 8 Maths Chapter 5 (Data Handling)
Q.1: The weekly wages (in Rs.) of 30 workers in a factory are: 830, 835, 890, 810, 835, 836, 869, 845, 898, 890, 820, 860, 832, 833, 855, 845, 804, 808, 812, 840, 885, 835, 835, 836, 878, 840, 868, 890, 806, 840.
Using tally marks, make a frequency table with intervals as 800 – 810, 810 – 820 and so on.
Solution: The frequency table with intervals as 800 – 810, 810 – 820 and so on, using tally marks is given below:

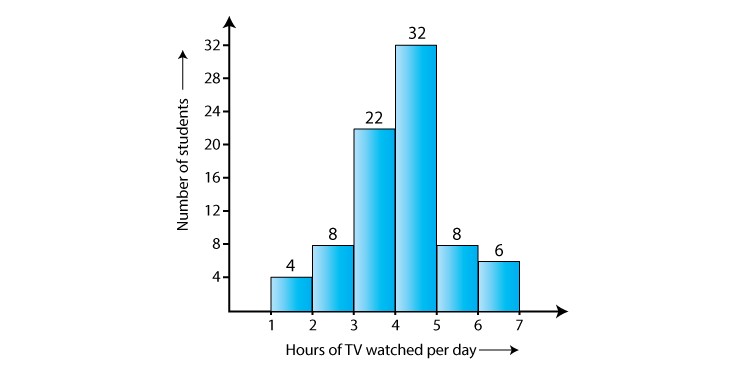
Q.2: The number of hours for which students of a particular class watched television during holidays is shown through the given graph. Answer the following:
(i) For how many hours did the maximum number of students watch T.V.?
(ii) How many students watched TV for less than 4 hours?
(iii) How many students spent more than 5 hours watching TV?
Solution:
(i) 32 students watched T.V for 4-5 hours.
Therefore, the maximum number of students who watched T.V. for 4 – 5 hours.
(ii) The number of students who watched T.V. less than 4 hours = 22 + 8 + 4 = 34
(iii) The number of students who spent more than 5 hours watching TV = 8 + 6 = 14
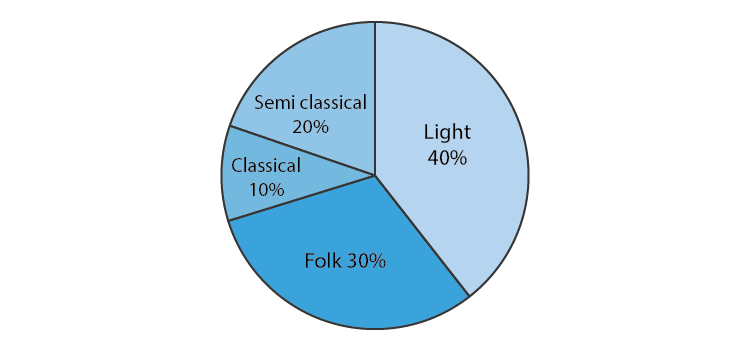
Q.3: A survey was made to find the type of music that a certain group of young people liked in a city. The adjoining pie chart shows the findings of this survey. From this pie chart, answer the following:
(i) If 20 people liked classical music, how many young people were surveyed?
(ii) Which type of music is liked by the maximum number of people?
(iii) If a cassette company were to make 1000 CD’s, how many of each type would they make?
Solution:
(i) 10% represents 20 people.
⟹100% represents = (100 x 20)/10 = 200
Therefore, 200 people were surveyed.
(ii) Since 40% of the total people surveyed liked light music and no other form of song liked more than that, we can conclude that the maximum number of people likes light music.
(iii) CD’s of classical music = (10 x 1000)/100 = 100
CD’s of semi-classical music = (20 x 1000)/100 = 200
CD’s of light music = (40 x 1000)/100 = 400
CD’s of folk music = (30 x 1000)/100 = 300
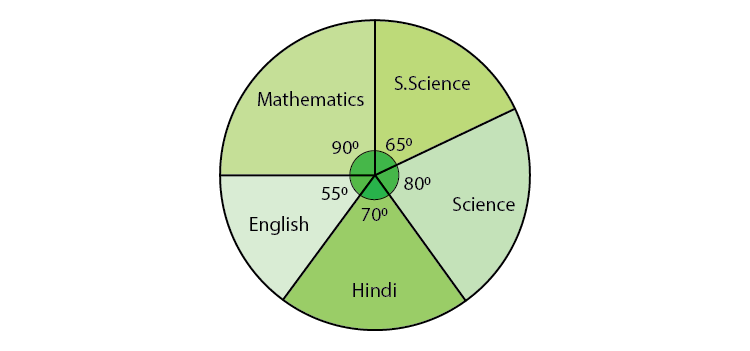
Q.4: The adjoining pie chart gives the marks scored in an examination by a student in Hindi, English, Mathematics, Social Science and Science. If the total marks obtained by the students were 540, answer the following questions.
(i) In which subject did the student score 105 marks?
(ii) How many more marks were obtained by the student in Mathematics than in Hindi?
(iii) Examine whether the sum of the marks obtained in Social Science and Mathematics is more than that in Science and Hindi.
Solution:

(i) The student scored 105 marks in Hindi.
(ii) Marks obtained in Mathematics = 135 Marks obtained in Hindi = 105
Difference = 135 – 105 = 30
Thus, 30 more marks were obtained by the student in Mathematics than in Hindi.
(iii) The total marks obtained in Social Science and Mathematics = 97.5 + 135 = 232.5
The total marks obtained in Science and Hindi = 120 + 105 = 225
Therefore, the sum of the marks in Social Science and Mathematics is more than that in Science and Hindi.
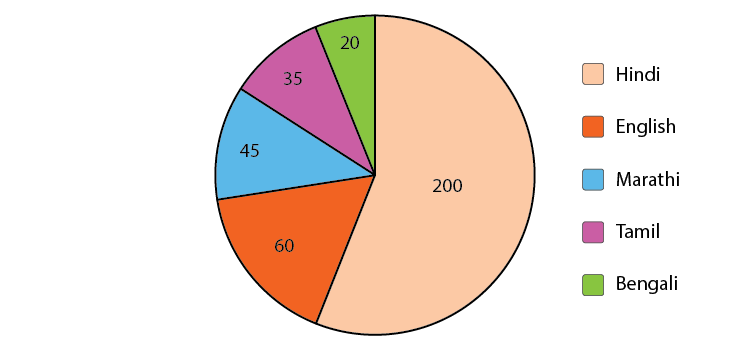
Q.5: The number of students in a hostel, speaking different languages is given below. Display the data in a pie chart.
| Language | Hindi | English | Marathi | Tamil | Bengali | Total |
| No. of students | 40 | 12 | 9 | 7 | 4 | 72 |
Solution:

The pie-chart for the above data will be:
Q.6: When a die is thrown, list the outcomes of an event of getting:
(i)
(a) a prime number
(b) not a prime number
(ii)
(a) a number greater than 5
(b) a number not greater than 5.
Solution:
(i)
(a) Outcomes of the event to get a prime number are 2, 3 and 5.
(b) Outcomes of an event of not getting a prime number are 1, 4 and 6.
(ii)
(a) Outcomes of the event of getting a number greater than 5 are 6.
(b) Outcomes of the event of not getting a number greater than 5 are 1, 2, 3, 4 and 5.
Q.7: Numbers 1 to 10 are written on ten separate slips (one number on one slip), kept in a box and mixed well. One slip is chosen from the box without looking into it. What is the probability of:
(i) getting a number 6?
(ii) getting a number less than 6?
(iii)getting a number greater than 6?
(iv)getting a 1-digit number?
Solution:
(i) The outcome of getting a number 6 from ten separate slips is one.
Therefore, the probability of getting a number 6 = 1/10
(ii) Numbers which are less than 6 are 1, 2, 3, 4 and 5. So total there are five numbers. Thus, there are 5 outcomes.
Therefore, the probability of getting a number less than 6 = 5/10 = ½
(iii) The number is greater than 6 out of ten that are 7, 8, 9, 10. So there are 4 possible outcomes.
Therefore, the probability of getting a number greater than 6 = 4/10 = ⅖
(iv) One digit numbers out of 1 to 10 are 1, 2, 3, 4, 5, 6, 7, 8, 9.
Therefore, the probability of getting a 1-digit number = 9/10
Q.8: If you have a spinning wheel with 3 green sectors, 1 blue sector and 1 red sector, what is the probability of getting a green sector? What is the probability of getting a non-blue sector?
Solution: A total of five sectors are present. Out of the five sectors, three sectors are green.
Therefore, the probability of getting a green sector = ⅗
Out of the five sectors, one sector is blue.
Hence, Number of Non-blue sectors = 5 – 1 = 4 sectors
Therefore, the probability of getting a non-blue sector will be equal to 4/5.
Also check:
- Important 2 Marks Question For Cbse Class 8 Maths
- Important 3 Marks Questions For Cbse Class 8 Maths
- Important 4 Marks Questions For Cbse Class 8 Maths
Extra Questions For Class 8 Maths Data Handling
Solve these extra questions given below, to check your skills for this particular chapter.
- In a deck of 52 cards, what is the probability of getting:
- Black cards
- Red Cards
- Face Cards
- When a die is thrown, what is the probability of getting a prime number?
- Draw a Bar Graph for the given data:
| School Supplies | Clip Board | crayon | Folder | Highlighter | Notebook | Binder |
| Items Sold | 6 | 7 | 7 | 9 | 12 | 14 |
4. Construct a pie chart for the given data:
| Method of travel | Walk | Bike | Car | Bus |
| Frequency | 9 | 3 | 6 | 12 |
5. If you have a spinning wheel with 3 green sectors, 1 blue sector and 1 red sector, what is the probability of getting a green sector? What is the probability of getting a non-blue sector?
6. Which of the following need a histogram to show the data?
(i) The number of letters for different areas in a postman’s bag.
(ii) The height of competitors in an athletics meet.
(iii) The number of cassettes produced by 5 companies.
(iv) The number of passengers boarding trains from 7 a.m to 7 p.m at a station.
7. When a die is thrown, list out the outcomes of an event that shows
(i) (a) a prime number
(b) not a prime number
(ii) (a) a number greater than 5
(b) a number not greater than 5
Comments