Venn diagrams are the diagrams that are used to represent the sets, relation between the sets and operation performed on them, in a pictorial way. Venn diagram, introduced by John Venn (1834-1883), uses circles (overlapping, intersecting and non-intersecting), to denote the relationship between sets. A Venn diagram is also called a set diagram or a logic diagram showing different set operations such as the intersection of sets, union of sets and difference of sets. It is also used to depict subsets of a set.
For example, a set of natural numbers is a subset of whole numbers, which is a subset of integers. The relation between the sets of natural numbers, whole numbers and integers can be shown by the Venn diagram, where the set of integers is the universal set. See the figure below.
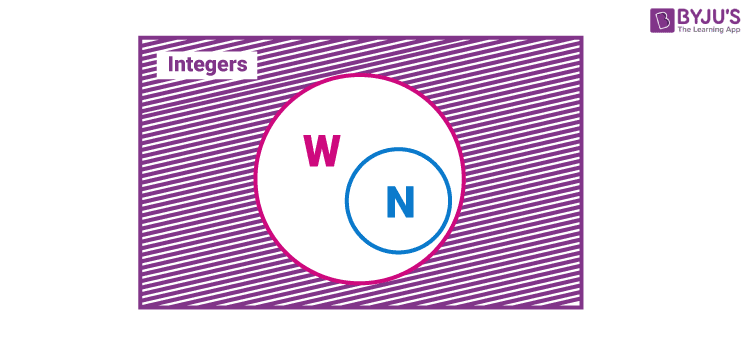
Here, W represents whole numbers and N represents natural numbers
The universal set (U) is usually represented by a closed rectangle, consisting of all the sets. The sets and subsets are shown by using circles or oval shapes.
| Table of Contents: |
What is a Venn Diagram?
A diagram used to represent all possible relations of different sets. A Venn diagram can be represented by any closed figure, whether it be a Circle or a Polygon (square, hexagon, etc.). But usually, we use circles to represent each set.
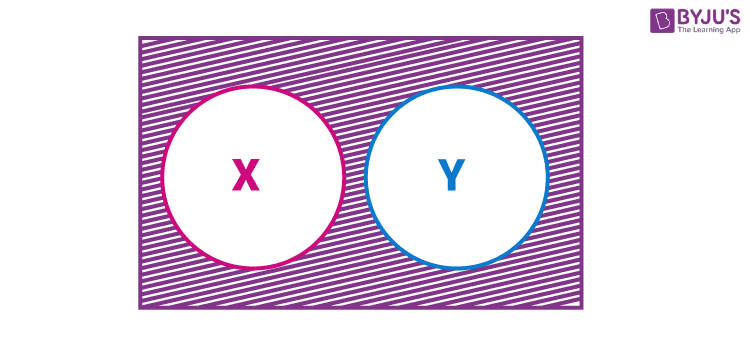
In the above figure, we can see a Venn diagram, represented by a rectangular shape about the universal set, which has two independent sets, X and Y. Therefore, X and Y are disjoint sets. The two sets, X and Y, are represented in a circular shape. This diagram shows that set X and set Y have no relation between each other, but they are a part of a universal set.
For example, set X = {Set of even numbers} and set Y = {Set of odd numbers} and Universal set, U = {set of natural numbers}
We can use the below formula to solve the problems based on two sets.
n(X ⋃ Y) = n(X) + n(Y) – n(X ⋂ Y)
Venn Diagram of Three Sets
Check the Venn diagram of three sets given below.
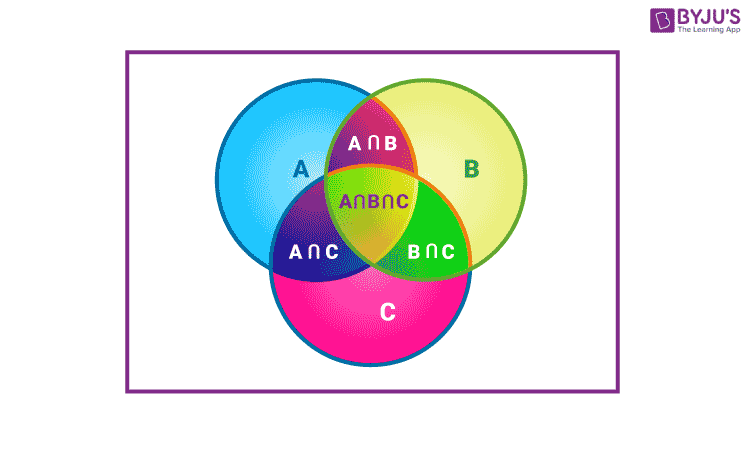
The formula used to solve the problems on Venn diagrams with three sets is given below:
n(A ⋃ B ⋃ C) = n(A) + n(B) + n(C) – n(A ⋂ B) – n(B ⋂ C) – n(A ⋂ C) + n(A ⋂ B ⋂ C)
Venn Diagram Symbols
The symbols used while representing the operations of sets are:
- Union of sets symbol: ∪
- Intersection of sets symbol: ∩
- Complement of set: A’ or Ac
How to draw a Venn diagram?
To draw a Venn diagram, first, the universal set should be known. Now, every set is the subset of the universal set (U). This means that every other set will be inside the rectangle which represents the universal set.
So, any set A (shaded region) will be represented as follows:
Figure 1:
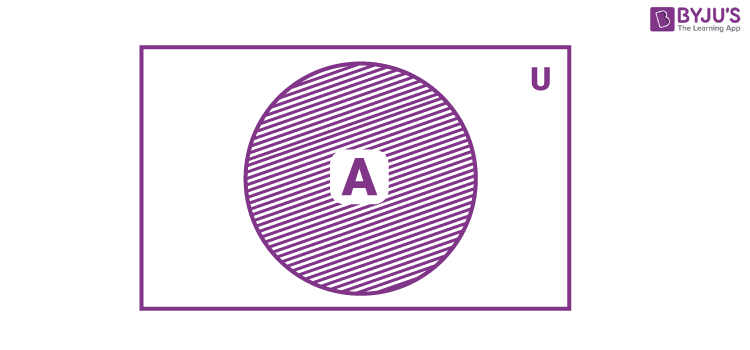
Where U is a universal set.
We can say from fig. 1 that
A ∪ U = U
All the elements of set A are inside the circle. Also, they are part of the big rectangle which makes them the elements of set U.
Venn Diagrams of Set operations
In set theory, there are many operations performed on sets, such as:
- Union of Set
- Intersection of set
- Complement of set
- Difference of set
etc. The representations of different operations on a set are as follows:
Complement of a set in Venn Diagram
A’ is the complement of set A (represented by the shaded region in fig. 2). This set contains all the elements which are not there in set A.
Figure 2:
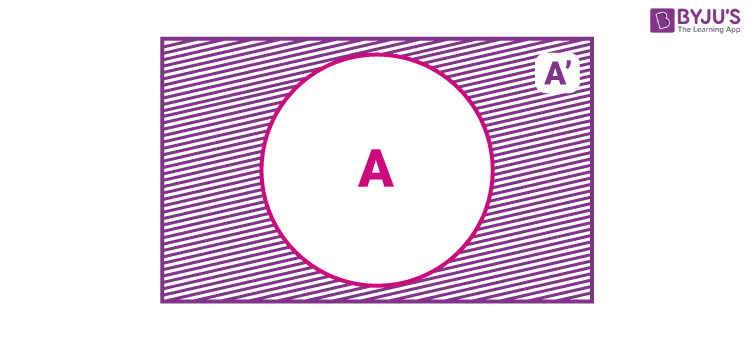
It is clear that from the above figure,
A + A’ = U
It means that the set formed with elements of set A and set A’ combined is equal to U.
(A’)’= A
The complement of a complement set is a set itself.
Properties of Complement of set:
- A ∪ A′ = U
- A ∩ A′ = φ
- (A ∪ B)′ = A′ ∩ B′
- (A ∩ B)′ = A′ ∪ B′
- U′ = φ
- φ′ = U
Intersection of two sets in Venn Diagram
A intersection B is given by: A ∩ B = {x : x ∈ A and x ∈ B}.
This represents the common elements between set A and B (represented by the shaded region in fig. 3).
Figure 3:
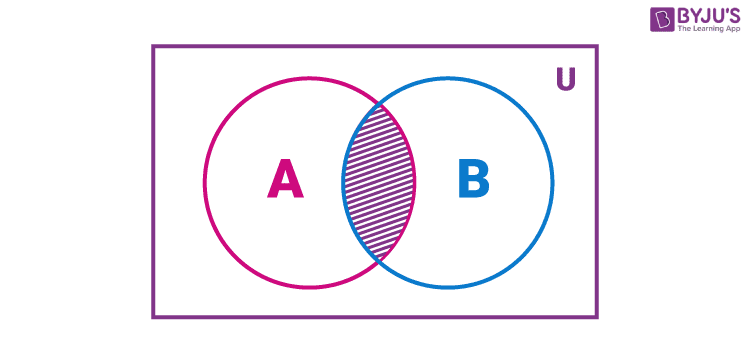
Intersection of two Sets
Properties of the intersection of sets operation:
- A ∩ B = B ∩ A
- (A ∩ B) ∩ C = A ∩ (B ∩ C)
- φ ∩ A = φ ; U ∩ A = A
- A ∩ A = A
- A ∩ (B ∪ C) = (A ∩ B) ∪ (A ∩ C)
- A ∪ (B ∩ C) = (A ∪ B) ∩ (A ∪ C)
Union of Two Sets in Venn Diagram
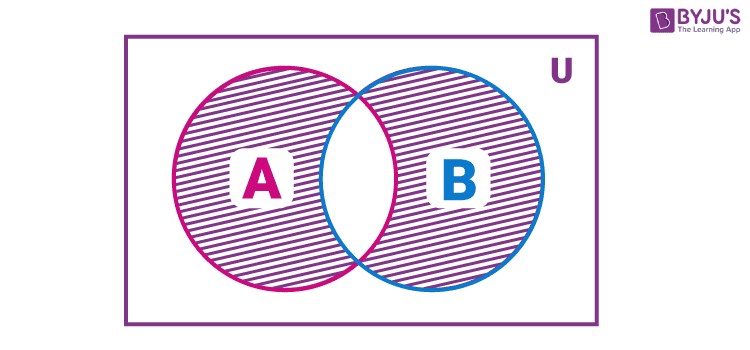
A union B is given by: A ∪ B = {x | x ∈A or x ∈B}.
This represents the combined elements of set A and B (represented by the shaded region in fig. 4).
Figure 4:
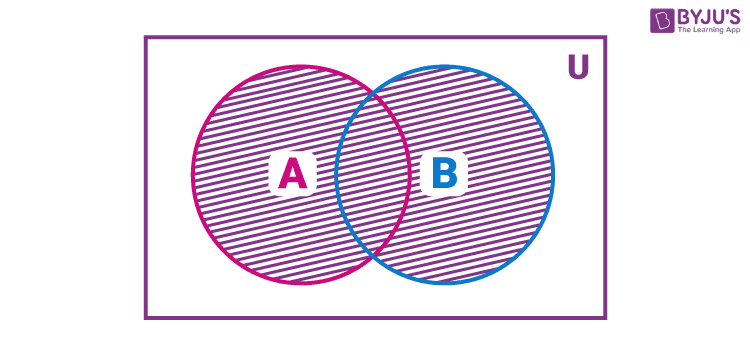
Union of two sets
Some properties of Union operation:
- A ∪ B = B ∪ A
- (A ∪ B) ∪ C = A ∪ (B ∪ C)
- A ∪ φ = A
- A ∪ A = A
- U ∪ A = U
Complement of Union of Sets in Venn Diagram
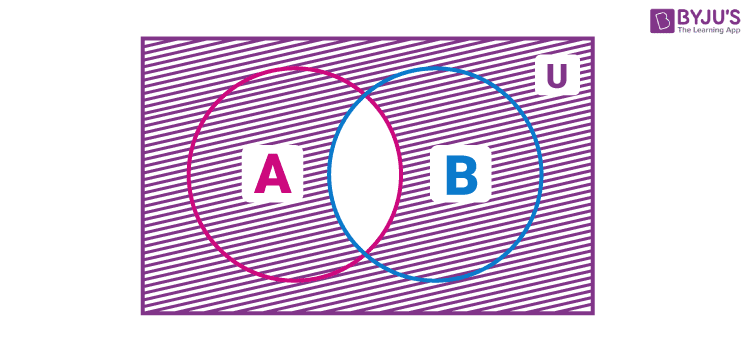
(A ∪ B)’: This is read as complement of A union B. This represents elements which are neither in set A nor in set B (represented by the shaded region in fig. 5).
Figure 5:
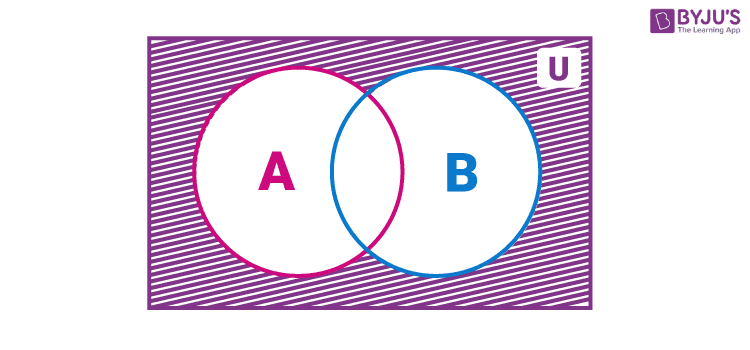
Complement of A U B
Complement of Intersection of Sets in Venn Diagram
(A ∩ B)’: This is read as complement of A intersection B. This represents elements of the universal set which are not common between set A and B (represented by the shaded region in fig. 6).
Figure 6:
Complement of A ∩ B
Difference between Two Sets in Venn Diagram
A – B: This is read as A difference B. Sometimes, it is also referred to as ‘relative complement’. This represents elements of set A which are not there in set B(represented by the shaded region in fig. 7).
Figure 7:
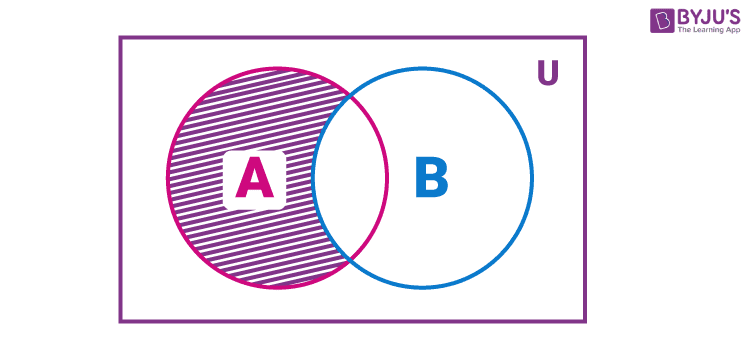
Difference between Two Sets
Symmetric difference between two sets in Venn Diagram
A ⊝ B: This is read as a symmetric difference of set A and B. This is a set which contains the elements which are either in set A or in set B but not in both (represented by the shaded region in fig. 8).
Figure 8:
Symmetric difference between two sets
Related Articles
Venn Diagram Example
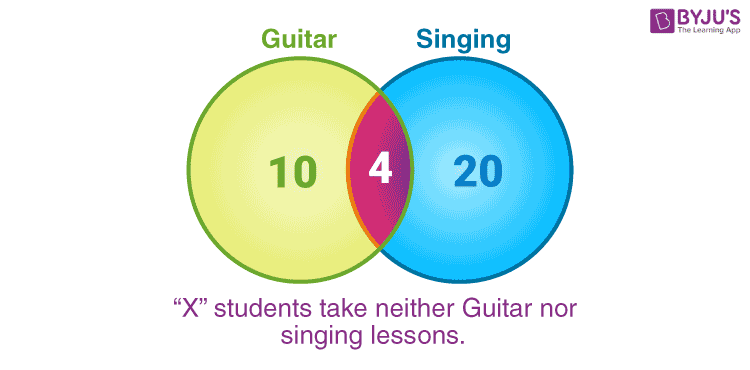
Example: In a class of 50 students, 10 take Guitar lessons and 20 take singing classes, and 4 take both. Find the number of students who don’t take either Guitar or singing lessons.
Solution:
Let A = no. of students who take guitar lessons = 10.
Let B = no. of students who take singing lessons = 20.
Let C = no. of students who take both = 4.
Now we subtract the value of C from both A and B. Let the new values be stored in D and E.
Therefore,
D = 10 – 4 = 6
E = 20 – 4 = 16
Now logic dictates that if we add the values of C, D, E and the unknown quantity “X”, we should get a total of 50 right? That’s correct.
So the final answer is X = 50 – C – D – E
X = 50 – 4 – 6 – 16
X = 24 [ Answer]
Venn’s diagrams are particularly helpful in solving word problems on number operations that involve counting. Once it is drawn for a given problem, the rest should be a piece of cake.
Venn Diagram Questions
- Out of 120 students in a school, 5% can play Cricket, Chess and Carroms. If so happens that the number of players who can play any and only two games are 30. The number of students who can play Cricket alone is 40. What is the total number of those who can play Chess alone or Carroms alone?
- Draw the diagram that best represents the relationship among the given classes:
Animal, Tiger, Vehicle, Car - At an overpriced department store, there are 112 customers. If 43 have purchased shirts, 57 have purchased pants, and 38 have purchased neither, how many purchased both shirts and pants?
- In a group, 25 people like tea or coffee; of these, 15 like tea and 6 like coffee and tea. How many like coffee?
To learn more from sets and other topics, download BYJU’S – The Learning App and explore the visual power of learning.
Frequently Asked Questions on Venn Diagram
What do you mean by venn diagram?
How do Venn diagrams work?
How do you do Venn diagrams in math?
What does A ∩ B mean?
What are the different types of Venn diagrams?
Two-set Venn diagram
Three-set Venn diagram
Four-set Venn diagram
Five-set Venn diagram
What are the four benefits of using Venn diagrams?
These are used for the classification and comparison of two things.
Different parameters can be obtained without much calculation, such as intersection, union, difference, etc.
Due to its pictorial representation, one can understand the given situation quickly.
These will make the complex calculation much simpler that involves sets.
Comments