A function is a relation between two sets of variables such that one variable depends on another variable. We can represent different types of functions in different ways. Usually, functions are represented using formulas or graphs. There are four ways for the representation of a function as given below:
- Algebraically
- Numerically
- Visually
- Verbally
| Type of Representation | Description |
| Algebraic | A function is represented using a mathematical model |
| Numerical | A function is represented using a table of values or chart |
| Visual | In this way of representation, the function is shown using a continuous graph or scooter plot |
| Verbal | Word description is used in this way to the representation of a function. |
Each one of them has some advantages and disadvantages. Let us look at them once and try to understand them.
Representation of a Function – Algebraic
The algebraic representation of a function refers to the expression of a function using an equation or mathematical model. As we know, the process of interpreting a real-world problem in a convenient function is called mathematical modelling. The resulting function and a representation of all input and output variables, including proper units of measure, are referred to as a mathematical model. Input/output diagrams often represent mathematical models.
It is one of the usual representations of functions. Here, functions are explicitly represented using formulas, and the functions are generally denoted by lower case alphabet letters. Let us take the cube function.
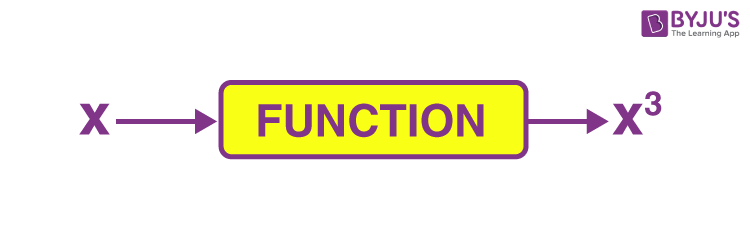
Figure 1: Block diagram depicting a cube function
The standard letter to represent function is f. However, it can be represented by any variable. To denote the function f algebraically, i.e., using the formula, we write:
where x is the variable indicating the input. It can be represented by any variable.
f is the name of the function
Though one of the easy and understandable ways of representing a function, it is not always easy to get the function’s formula. For those cases, we use other methods of representation.
| Read more: |
Representation of a Function- Visual
This is basically the graphical representation of functions. This way of representation is very easy to understand. The input values are marked along the x-axis. For any input value, the corresponding output value is the vertical displacement from the x-axis. For e.g. at x = a, the output is equal to f(a).
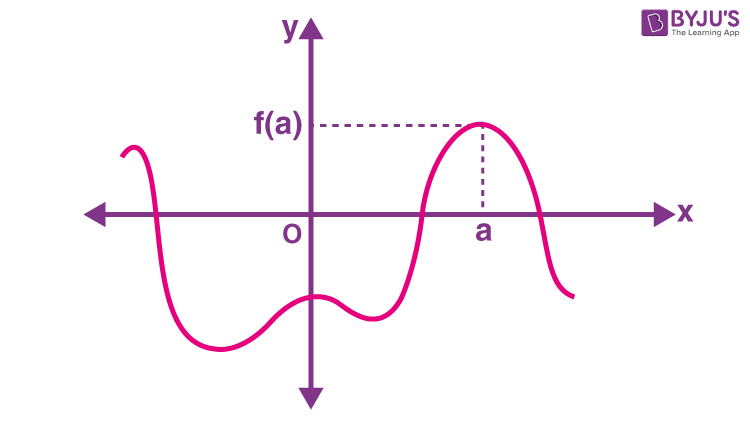
Figure 2: Graph of a function
The graph shows the properties of the functions. For e.g. from figure 2, we can directly tell:
- where the graph is increasing or decreasing
- where the rate of change is more and where it is less
- where are the extreme values
Thus, graphs are very beneficial for studying the behaviour of the function. One drawback is that we can’t always get the exact values of all the outputs from the graph.
Learn more about functions and their graphs here.
Representation of a Function- Numerical
This is basically the tabular way of representing a function. The table contains two columns; one with the dependent variable and the other with the independent variable. To show an example, let us take the function f and independent variable as x. The table is given as:
Table 1: Table representing a function f(x) = 2x
| x | f(x) |
| -1 | -2 |
| – 0.5 | -1 |
| 0 | 0 |
| 0.5 | 1 |
| 1 | 2 |
| 1.5 | 3 |
Though we have the exact value of the outputs, we can only have a finite number of such outputs. The analysis of the function and study of its behaviour hence becomes difficult.
Representation of a Function- Verbal
In this way of representing functions, we use words. For e.g.
- For the input x, the function gives the largest integer smaller than or equal to x, i.e. floor function (see fig. 3).
- For the input x, the function gives the value equal to x, i.e. identity function (see fig. 4).
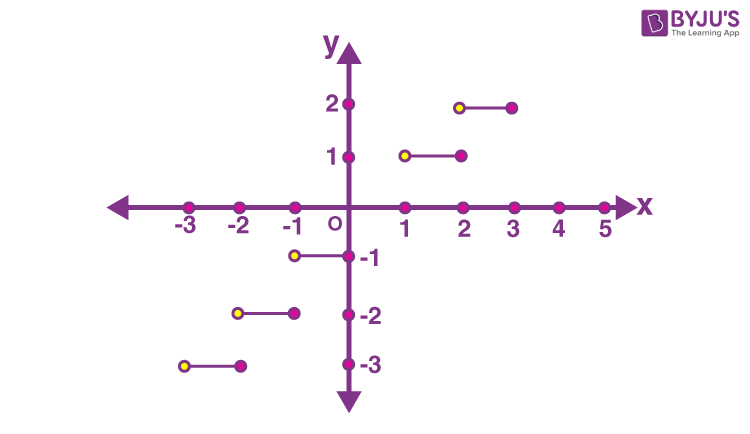
Figure 3: Floor function
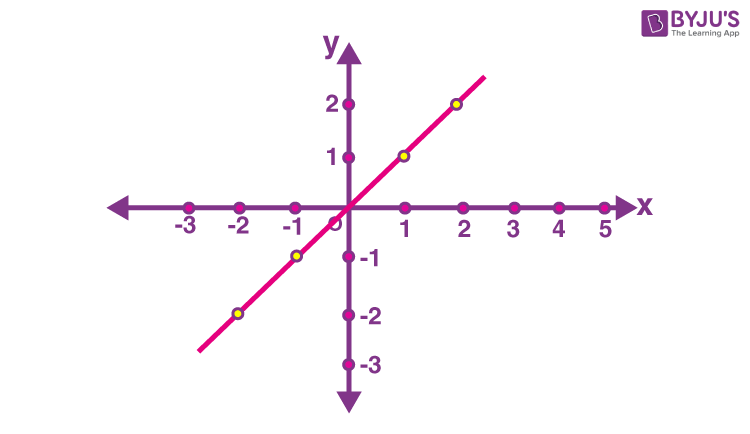
Figure 4: Identity function
Frequently Asked Questions – FAQs
A function can be represented in how many ways?
Verbal function represented by?
Algebraic function is represented by what?
Which function is represented chart?
Which function is represented by a continuous graph?
Each of the representations has its pros and cons. According to the information required, appropriate representation should be adopted. To learn more about functions, visit BYJU’S and fall in love with learning!

Comments