In Statistics, a t-test, can be expressed as a statistical hypothesis test where the test statistic maintains a student’s t-distribution, if the null hypothesis is set. Hence, we use the t-test table here. In Paired T-Test, they analyse the means of two groups of observations. The observations need to be randomly allocated to each of the two groups. Hence, the difference in response observed is due to the procedure and not because of any other factors.
If two samples are provided, then we can pair the observation of one sample with the observation of another sample. This test can be applied in making observations on the identical sample before and after an event.
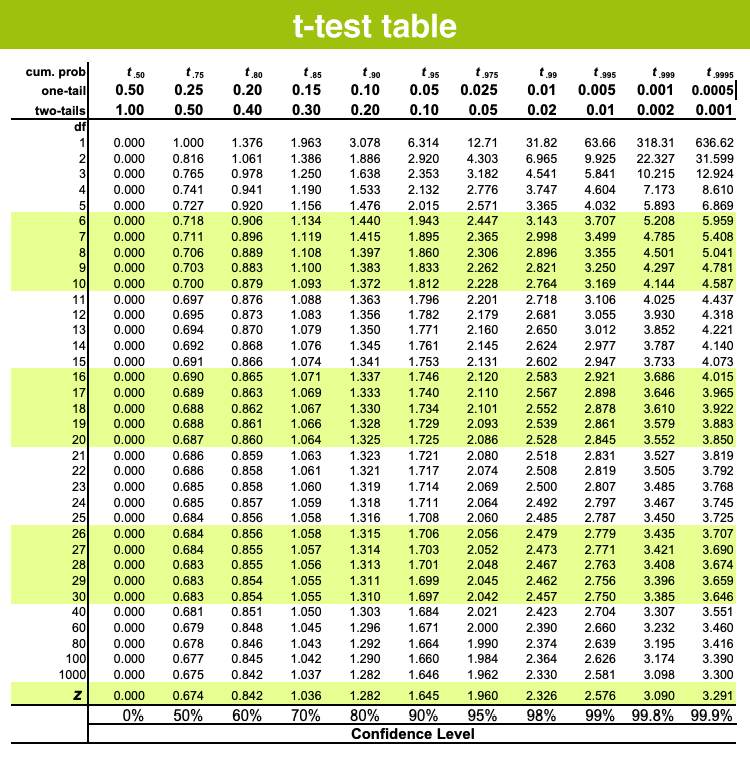
T-test Table (One-tail & Two-tail)
The t-test table is used to evaluate proportions combined with z-scores. This table is used to find the ratio for t-statistics. The t-distribution table displays the probability of t-values from a given value. The acquired probability is the t-curve area between the t-distribution ordinates, i.e., the given value and infinity.
In the t-test table, the significant values are determined for degrees of freedom(df) to the probabilities of t-distribution, α.
Also, read:
T-Test Formula
The t-test is any statistical theory test in which the analysis statistic supports a student’s t-distribution under the null hypothesis. It could be used to conclude if two sets of data are significantly distinct from each other, and is most usually used when the test statistic would match a normal distribution, if the value of a scaling session in the test statistic were known.
T-test employs means and standard deviations of two samples to do a comparison. The formula for T-test is given below:
where
where,
S1 = Standard deviation of first set of values
S2 = Standard deviation of second set of values
n1 = Total number of values in first set
n2 = Total number of values in the second set.
We can also represent the formula as:
Where,
X̄ = Mean of first sample
μ = Mean of second sample
s/√N = Estimate of standard error difference between the means.
Comments