Before getting started, let’s understand what are quartiles? Quartiles are the values that divide a list of numerical data into three quarters. There are three quartiles, first, second and third, denoted by Q1, Q2 and Q3. Here, Q2 is nothing but the median of the given data.
Range in Statistics
In Statistics, the range is the smallest of all the measures of dispersion. It is the difference between the two extreme conclusions of the distribution. In other words, the range is the difference between the maximum and the minimum observation of the distribution.
It is defined by
Range = Xmax – Xmin
Where Xmax is the largest observation and Xmin is the smallest observation of the variable values.
Interquartile Range Definition
The interquartile range defines the difference between the third and the first quartile. Quartiles are the partitioned values that divide the whole series into 4 equal parts. So, there are 3 quartiles. First Quartile is denoted by Q1 known as the lower quartile, the second Quartile is denoted by Q2 and the third Quartile is denoted by Q3 known as the upper quartile. Therefore, the interquartile range is equal to the upper quartile minus lower quartile.
Interquartile Range Formula
The difference between the upper and lower quartile is known as the interquartile range. The formula for the interquartile range is given below
Interquartile range = Upper Quartile – Lower Quartile = Q3 – Q1
where Q1 is the first quartile and Q3 is the third quartile of the series.
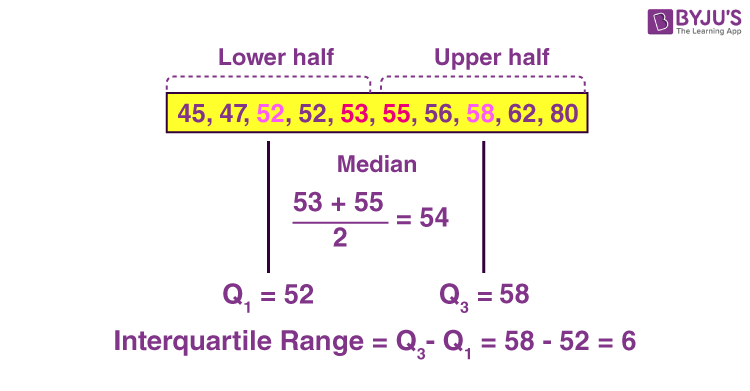
The below figure shows the occurrence of median and interquartile range for the data set.
Semi Interquartile Range
The semi-interquartile range is defined as the measures of dispersion. Semi interquartile range also is defined as half of the interquartile range. It is computed as one half the difference between the 75th percentile (Q3) and the 25th percentile (Q1). The semi-interquartile range is one-half of the difference between the first and third quartiles. The Formula for Semi Interquartile Range is
Semi Interquartile Range = (Q3– Q1) / 2
Median and Interquartile Range
The median is the middle value of the distribution of the given data. The interquartile range (IQR) is the range of values that resides in the middle of the scores. When a distribution is skewed, and the median is used instead of the mean to show a central tendency, the appropriate measure of variability is the Interquartile range.
Q1 – Lower Quartile Part
Q2 – Median
Q3 – Upper Quartile Part
It is a measure of dispersion based on the lower and upper quartile. Quartile deviation is obtained from interquartile range on dividing by 2, hence also known as semi interquartile range.
How to Calculate the Interquartile Range?
The procedure to calculate the interquartile range is given as follows:
- Arrange the given set of numbers into increasing or decreasing order.
- Then count the given values. If it is odd, then the center value is median otherwise obtain the mean value for two center values. This is known as Q2 value. If there are even number of values, the median will be the average of the middle two values.
- Median equally cuts the given values into two equal parts. They are described as Q1 and Q3 parts.
- The median of data values below the median represents Q1.
- The median of data values above the median value represents Q3.
- Finally, we can subtract the median values of Q1 and Q3.
- The resulting value is the interquartile range.
Interquartile Range Example
Question:
Determine the interquartile range value for the first ten prime numbers.
Solution:
Given: The first ten prime numbers are:
2, 3, 5, 7, 11, 13, 17, 19, 23, 29
This is already in increasing order.
Here the number of values = 10
10 is an even number. Therefore, the median is mean of 11 and 13
That is Q2 = (11 + 13)/2 = 24/2 = 12.
Now we have to get two parts i.e. lower half to find Q1 and the upper half to find Q3.
Q1 part : 2, 3, 5,7,11
Here the number of values = 5
5 is an odd number. Therefore, the center value is 5, that is Q1= 5
Q3 part : 13, 17, 19, 23, 29
Here the number of values = 5
5 is an odd number. Therefore, the center value is 19, that is Q3= 19
The subtraction of Q1 and Q3 value is 19 – 5 = 11
Therefore, 11 is the interquartile range value.
Register with BYJU’S – The Learning App and also download the app for more interesting and engaging videos.
