Suppose you were given some random people’s names and their phone numbers and asked to arrange them. How will you handle this so that it can be easily recollected? In our day-to-day life, we handle lots of situations like this. And this is the time when data handling comes in handy. We can record data in various ways; pictograph is one of them. Let us learn more about the topic.
Data and Pictograph
Data is set of collection of names, numbers, figures, etc., that convey some information. In simple words, data is just a collection of raw facts and figures. It can be about anything. Data is made based on observations, research or analysis. We can depict data in different forms such as tables, charts, pictures, graphs, etc.
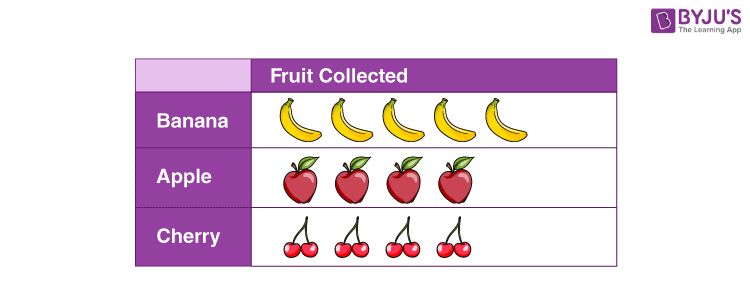
A pictograph is a pictorial representation of a word or expression. It is one of the methods of recording data in a more interesting way. In pictograph, data is recorded in form of images and these images help us to understand statistical information in a much easier way. However, it demands a lot of attention because the chances of misinterpretation are high. A pictograph is also known as a pictogram, pictorial chart, picture graph and many more.
Drawing a Pictograph
As mentioned before, pictograph is all about pictures and pictorial representation. To make it more interesting, a pictogram must be precise and properly described. Hence, we should be alert using images that we will use to represent the data. Let’s construct a pictogram of the following data.
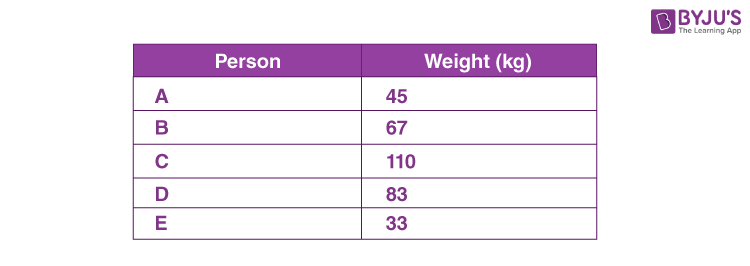
The following are the weights of five persons. Here we will represent this data as a pictograph, as shown below.
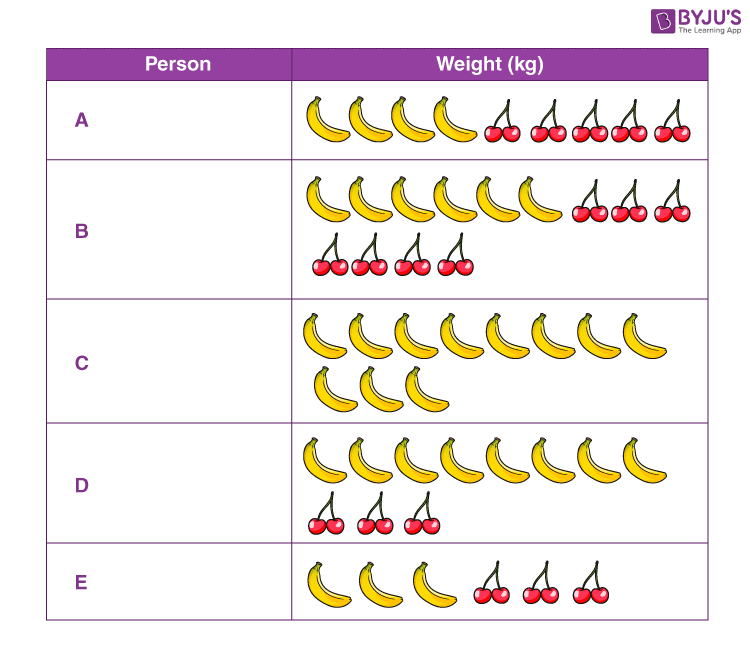
Representation: We will use bananas and cherry to picture this data. Below are values of banana and cherry:

Pictograph: A pictogram of the above data would be:
Frequently Asked Questions – FAQs
If one banana costs 10 rupees what will be the cost of 10 bananas?
10 banana’s costs = 10 × 10=100 rupees
If 10 apples cost 50 rupees then what is the cost of one apple?
Then cost of 1 apple = 50/10 = 5 rupees
If 1 banana costs 5 rupees and 2 apples cost 10 rupees, what is the cost of 1 banana and 2 apples?
Pictographs are always represented with what?
What will be the cost of 5 pens if one pen cost is 5 rupees?
Then Cost of 5 pens = 5 × 5= 25 rupees

Comments