The Central Limit Theorem defines that the mean of all the given samples of a population is the same as the mean of the population(approx) if the sample size is sufficiently large enough with a finite variation. It is one of the main topics of statistics.
Also, learn:
In this article, let us discuss the “Central Limit Theorem” with the help of an example to understand this concept better.
Central Limit Theorem Definition
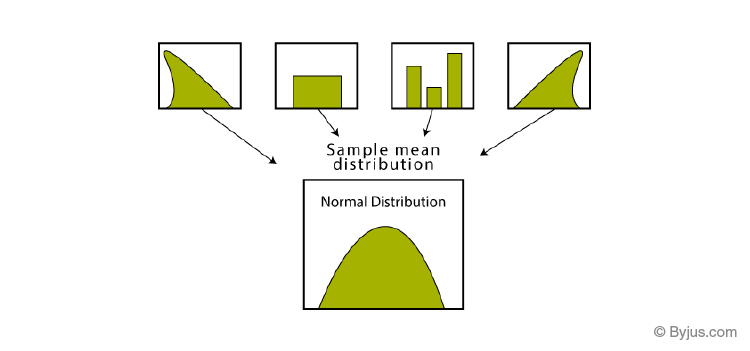
The Central Limit Theorem (CLT) states that the distribution of a sample mean that approximates the normal distribution, as the sample size becomes larger, assuming that all the samples are similar, and no matter what the shape of the population distribution.
Central Limit Theorem Example
Let us take an example to understand the concept of Central Limit Theorem (CLT):

Suppose you have 10 teams in your school(Sports). Each team will have 100 students in it. Now, we want to measure the average height of the students in the sports team. The simplest way to do would be to find the average of their heights. The first step in this would be to measure the weight of all the students individually and then add them. Then, Divide the sum of their weights with the total number of students. This way we will get the average height. But this method will not make sense for long calculations as it would be tiresome and very long.
So, we will use CTL(Central Limit Theorem) to make the calculation easy. In this method, we will randomly pick students from different teams and make a sample. Each sample will include 20 students. Then, we will follow the following steps to solve it.
- Take all these samples and find the mean for each individual sample.
- Now, Find the mean of the sample means.
- This way we will get the approximate mean height of the students in the sports team.
- We will get a bell curve shape if we will find the histogram of these sample mean heights.
Note: The sample taken should be sufficient by size. When the sample size gets larger, the sample means distribution will become normality as we calculate it using repeated sampling.
Central Limit Theorem Formula
The central limit theorem is applicable for a sufficiently large sample size (n≥30). The formula for central limit theorem can be stated as follows:

Where,
μ = Population mean
σ = Population standard deviation
μx = Sample mean
σx= Sample standard deviation
n = Sample size
Applications of Central Limit Theorem
| Statistical Application of CLT | Practical Significance of CLT |
| If the distribution is not known or not normal, we consider the sample distribution to be normal according to CTL. As this method assume that the population given is normally distributed. This helps in analyzing data in methods like constructing confidence intervals. | One of the most common applications of CLT is in election polls. To calculate the percentage of persons supporting a candidate which are seen on news as confidence intervals. |
| To estimate the population mean more accurately, we can increase the samples taken from the population which will ultimately decrease the sample means deviation. | It is also used to measure the mean or average family income of a family in a particular region. |
| To create a range of values which is likely to include the population mean, we can use the sample mean. |
Register with BYJU’S – The Learning App to learn more on Statistics and also watch interactive videos to learn with ease.