The visual way of representing a hierarchy in a tree-like structure is called a tree diagram. A typical tree structure consists of a root node, node and leaf node.
- Root node: A root node is a member that has no superior parent
- Node: The nodes are connected from the root nodes that are linked together with the help of line connections called links or branches which shows the relationship between the members.
- Leaf Node: Leaf node called as end nodes are the members which do not contain any children or child node.
A tree diagram is often used:
- In mathematics and computer science
- To show family relations
- In taxonomy, to show classification
Also, read:
| Related Links | |
| Probability | Empirical And Theoretical Probability |
| Probability And Statistics | Events in Probability |
| Probability for Class 11 | Probability For Class 12 |
In mathematics, the tree diagram is used in probability and statistics and it allows us to calculate the number of possible outcomes of an event where those outcomes are listed in an organised manner. Each path of the branches in the tree diagram represents one outcome of an event. It is a simple way of representing the sequences of events and it records all the possible outcomes in an uncomplicated and clear manner.
In general, tree diagram starts with the one item or node, that branches into two or more, then each of the nodes will branch into two or more, and so on. Then the final diagram resembles a tree with a trunk and multiple branches.
Tree Diagram in Probability
In probability theory, a tree diagram could be utilised to express a probability space. These diagrams may describe a sequence of independent events (for example a set of a coin tossed) or conditional probabilities (like drawing cards from a deck, without substituting the cards).
Every node on the tree diagram shows an event and is connected with the probability of that happening. The root node denotes the specific event and therefore it has a probability as 1. All set of sibling joints or nodes designates an independent and exhaustive distribution of the parent event.
Sometimes we feel difficulties while calculating probabilities and it is hard to figure out what to do. Tree diagram will rescue this difficulty. Consider an example in probability to draw a tree diagram for tossing a coin. There are two branches: head and tail. The probability of an event is written on the branch and the outcome are written at the end of the branch.
Therefore, the tree diagram to represent the probability of tossing a coin is given below.
We can also draw a tree diagram for tossing two coins:
How to calculate the overall probability in the Tree Diagram?
Probability means the likelihood of occurrence of the events. The probability value is a numerical value and it always lies between 0 and 1. The probability of an impossible event is zero and the probability of the sure event is 1. The formula to find out the probability is given as
Probability of an event, P(E) = Number of favourable outcomes/ Total number of outcomes.
Also, there is the number of probability formulas in probability theory, each depends upon the type of event.
While tossing a coin, the probability of getting heads is 0.5 or 1/2 and the probability of getting tails is 0.5 or 1/2.
Steps to calculate overall probability:
- Write the probability value on the branches.
- Then, multiply the probability value along the branches.
- Finally, add the probability value obtained after the multiplication process.
When you add all the probability values obtained, the result should be equal to 1.
Example of Tree Diagram
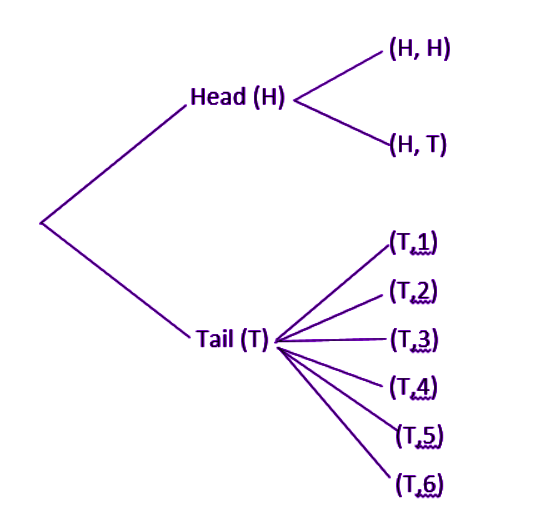
Consider the experiment of tossing a coin. If the coin shows head, toss it again but if it shows a tail, then throw a die. Find the conditional probability of the event that ‘the die shows a number greater than 4’ given that ‘there is at least one tail’.
Solution: The results of the experiment expressed in a diagrammatic manner called the ‘tree diagram’, where branches and nodes of the tree explain the event or a happening.
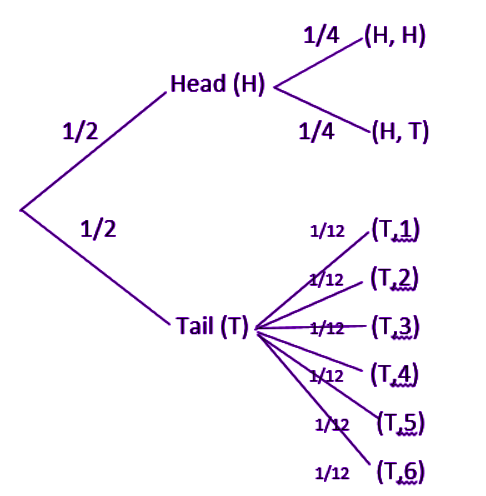
The sample space of the experiment may be described as S = {(H, H), (H, T), (T, 1), (T, 2), (T, 3), (T, 4), (T, 5), (T, 6)} where (H, H) denotes that both the tosses result into head and (T, i) denote the first toss result into a tail and the number is appeared on the die for i = 1,2,3,4,5,6. Thus, the probabilities assigned to the 8 elementary events (H, H), (H, T), (T, 1), (T, 2), (T, 3) (T, 4), (T, 5), (T, 6) are 1/4, 1/4, 1/12, 1/12, 1/12, 1/12, 1/12, 1/12 respectively.
Let F be the event that ‘there is at least one tail’ and E be the event ‘the die shows a number greater than 4’. Then:
F = {(H,T), (T,1), (T,2), (T,3), (T,4), (T,5), (T,6)}
E = {(T,5), (T,6)} and E ∩ F = {(T,5), (T,6)}
Now P(F) = P({(H,T)}) + P ({(T,1)}) + P ({(T,2)}) + P ({(T,3)}) + P ({(T,4)}) + P({(T,5)}) + P({(T,6)})
= 1/4 + 1/12 + 1/12 + 1/12 + 1/12 + 1/12 + 1/12
= 3/4
and P(E ∩ F) = P ({(T,5)}) + P ({(T,6)}) = 1/12 + 1/12 = 1/6
Hence, P(E|F) = P(E ∩ F)/P(F) = (1/6)/(3/4) = 2/9
Sample Problem
The sample example for finding the probability using a tree diagram is given below
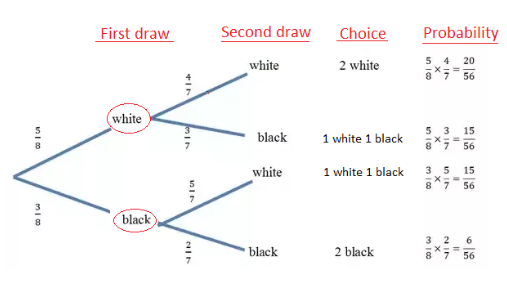
Question: A bag contains 3 black and 5 white balls. Draw the probability tree diagram for two draws.
Solution: Given:
No. of black balls = 3
No. of white balls = 5
Total Number of balls = 8
So, the probability of getting black balls = 3/8
The probability of getting white balls = 5/8
Therefore, the tree diagram for two draws of balls with possible outcomes and probability is given as below.
For more information on tree diagram and probabilities, register with BYJU’S – The Learning App and also watch other maths-related videos.
Comments