In statistics, the central tendency is the descriptive summary of a data set. Through the single value from the dataset, it reflects the centre of the data distribution. Moreover, it does not provide information regarding individual data from the dataset, where it gives a summary of the dataset. Generally, the central tendency of a dataset can be defined using some of the measures in statistics.
Definition
The central tendency is stated as the statistical measure that represents the single value of the entire distribution or a dataset. It aims to provide an accurate description of the entire data in the distribution.


Measures of Central Tendency
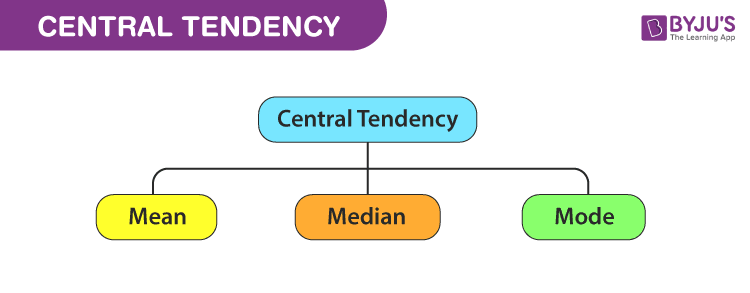
The central tendency of the dataset can be found out using the three important measures namely mean, median and mode.
Mean
The mean represents the average value of the dataset. It can be calculated as the sum of all the values in the dataset divided by the number of values. In general, it is considered as the arithmetic mean. Some other measures of mean used to find the central tendency are as follows:
- Geometric Mean
- Harmonic Mean
- Weighted Mean
It is observed that if all the values in the dataset are the same, then all geometric, arithmetic and harmonic mean values are the same. If there is variability in the data, then the mean value differs. Calculating the mean value is completely easy. The formula to calculate the mean value is given by:
The histogram given below shows that the mean value of symmetric continuous data and the skewed continuous data.
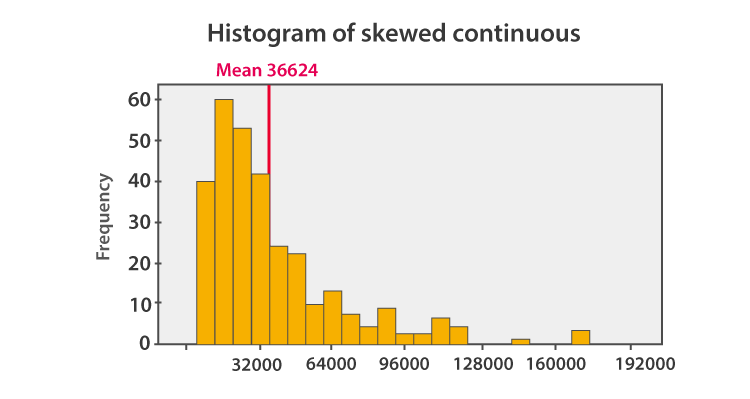
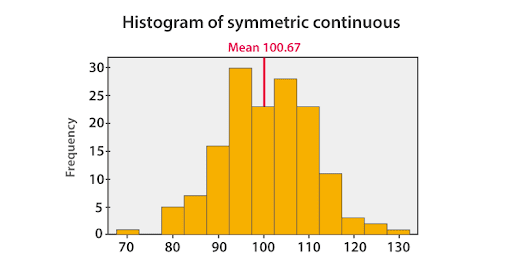
In symmetric data distribution, the mean value is located accurately at the centre. But in the skewed continuous data distribution, the extreme values in the extended tail pull the mean value away from the centre. So it is recommended that the mean can be used for the symmetric distributions.
Median
Median is the middle value of the dataset in which the dataset is arranged in the ascending order or in descending order. When the dataset contains an even number of values, then the median value of the dataset can be found by taking the mean of the middle two values.
Consider the given dataset with the odd number of observations arranged in descending order – 23, 21, 18, 16, 15, 13, 12, 10, 9, 7, 6, 5, and 2
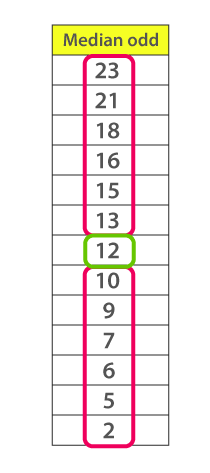
Here 12 is the middle or median number that has 6 values above it and 6 values below it.
Now, consider another example with an even number of observations that are arranged in descending order – 40, 38, 35, 33, 32, 30, 29, 27, 26, 24, 23, 22, 19, and 17
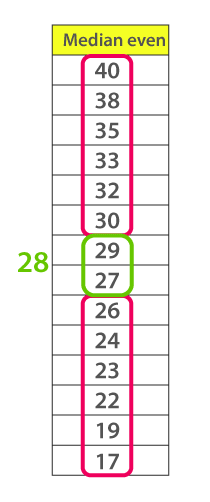
When you look at the given dataset, the two middle values obtained are 27 and 29.
Now, find out the mean value for these two numbers.
i.e.,(27+29)/2 =28
Therefore, the median for the given data distribution is 28.
Mode
The mode represents the frequently occurring value in the dataset. Sometimes the dataset may contain multiple modes and in some cases, it does not contain any mode at all.
Consider the given dataset 5, 4, 2, 3, 2, 1, 5, 4, 5
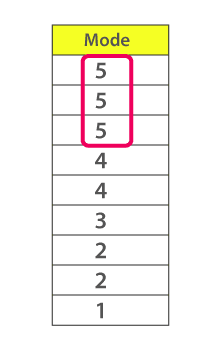
Since the mode represents the most common value. Hence, the most frequently repeated value in the given dataset is 5.
Based on the properties of the data, the measures of central tendency are selected.
- If you have a symmetrical distribution of continuous data, all the three measures of central tendency hold good. But most of the times, the analyst uses the mean because it involves all the values in the distribution or dataset.
- If you have skewed distribution, the best measure of finding the central tendency is the median.
- If you have the original data, then both the median and mode are the best choice of measuring the central tendency.
- If you have categorical data, the mode is the best choice to find the central tendency.
Video Lesson
Measure of Central Tendency

Measures of Central Tendency and Dispersion
The central tendency measure is defined as the number used to represent the center or middle of a set of data values. The three commonly used measures of central tendency are the mean, median, and mode.
A statistic that tells us how the data values are dispersed or spread out is called the measure of dispersion. A simple measure of dispersion is the range. The range is equivalent to the difference between the highest and least data values. Another measure of dispersion is the standard deviation, representing the expected difference (or deviation) among a data value and the mean.
For more information on statistics, register with BYJU’S – The Learning App and also watch videos to learn with ease.
Frequently Asked Questions – FAQs
What are the 4 measures of central tendency?
What are central tendency examples?
How do you find the central tendency?
What is the purpose of central tendency?
What is the difference between mean and median?
Which is the best central tendency measure?
| Related Links | |
| Arithmetic Mean And Range | Mean |
| Median | Mode of Data & Statistics |

This aap is most beneficial for student’s who are going to prepere any exam,i like this aap whenever i want to search any questions i firstly go to this aap because the questions here are very easy to learn and understand.
Very compendium material , simply explicit which can be understood by every one even non statics background,
Thanks 👍👍👍
I’m totally satisfied,
It’s very used Full for me..
Thank you!