In Statistics, you might have studied the methods of finding a representative value for the given data, i.e. the measure of central tendency. To recall, mean, median, and mode are three measures of central tendency. As we know, measuring central tendency gives us an idea of where data points are centred. However, to interpret the data thoroughly, we should also see how the data are scattered. And how much they have bunched about a measure of central tendency.
Range in Statistics
As the measures of central tendency are not enough to give complete information about a given data. Variability is another determinant that is required to be studied under statistics. Similar to measures of central tendency, we need to have a single number to describe variability. This single number has expressed a measure of dispersion. In this article, you will learn about one of the measures of dispersion called range.
| Read more: |
Range Meaning
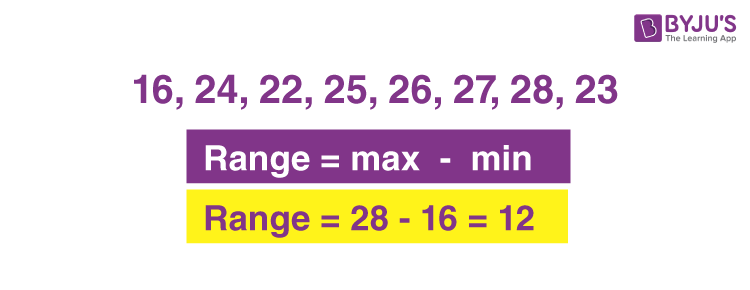
In statistics, the difference between the highest and lowest observations in a given data is called its Range.
Range Formula
The formula to calculate the range of a data set is given below:
Range = Maximum value – Minimum value
However, we can define the formulas to find the range of grouped and ungrouped data.
Range of Ungrouped Data
The formula to find the range of ungrouped data or discrete distribution of data is given as:
Range = Highest value of the data set – Lowest value of the data set
Range of Grouped Data
In the case of continuous frequency distribution or grouped data, the range is defined as the difference between the upper limit of the maximum interval of the grouped data and the lower limit of the minimum interval. It is the simplest measure of dispersion. It gives a comprehensive view of the total spread of the observations. Thus, the formula to calculate the range of a grouped data is given below:
Range = Upper-class boundary of the highest interval – Lower class boundary of the lowest interval
How to Find the Range
To understand the method of calculating range for different types of data in statistics, go through the solved examples given below. These examples help in understanding how to find the range for discrete and continuous data.
Solved Examples
Example 1: Find the range of the data: 21, 6, 17, 18, 12, 8, 4, 13
Solution:
Given,
21, 6, 17, 18, 12, 8, 4, 13
Highest value = 21
Lowest value = 4
Range = Highest value – Lowest value
= 21 – 4
= 17
Example 2: Age (in years) of 6 boys and 6 girls are recorded as below:
| Girls | 6 | 7 | 9 | 8 | 10 | 10 |
| Boys | 7 | 9 | 12 | 14 | 13 | 17 |
(a) Find the range for each group.
(b) Find the range if the two groups are combined together.
Solution:
(a) The range for group of girls = 10 – 6 = 4
The range for group of boys = 17 – 7 = 10
(b) If the ages of the group of boys and girls are combined, then the range will be:
17 – 4 = 13
Example 3: Calculate the range for the given frequency distribution.
| Class Interval | 10 – 20 | 20 – 30 | 30 – 40 | 40 – 50 | 50 – 60 | 60 – 70 | 70 – 80 |
| Frequency | 2 | 3 | 14 | 8 | 3 | 8 | 2 |
Solution:
We know that the range of grouped data is given by the formula:
Range = Upper-class boundary of the highest interval – Lower class boundary of the lowest interval
Here, the Upper-class boundary of the highest interval = 80
Lower class boundary of the lowest interval = 10
Therefore, range = 80 – 10 = 70
Example 4: Find the range of the following data.
| CI | 16 – 20 | 21 – 25 | 26 – 30 | 31 – 35 | 36 – 40 | 41 – 45 | 46 – 50 | 51 – 55 |
| f | 5 | 6 | 12 | 14 | 26 | 12 | 16 | 9 |
Solution:
Given data is not continuous frequency distribution.
Now, we have to convert the given data into continuous frequency distribution by subtracting 0.5 from the lower limit and adding 0.5 to the upper limit of each class interval.
| CI | 15.5 – 20.5 | 20.5 – 25.5 | 25.5 – 30.5 | 30.5 – 35.5 | 35.5 – 40.5 | 40.5 – 45.5 | 45.5 – 50.5 | 50.5 – 55.5 |
| f | 5 | 6 | 12 | 14 | 26 | 12 | 16 | 9 |
Here,
Upper-class boundary of the highest interval = 55.5
Lower class boundary of the lowest interval = 15.5
Therefore, range = 55.5 – 15.5 = 40
Practice Problems
-
- The marks in a subject for 12 students are as follows:
31, 37, 35, 38, 42, 23, 17, 18, 35, 25, 35, 29
For the given data, find the range.
- Given below are heights of 15 students of a class measured in cm:
- The marks in a subject for 12 students are as follows:
128, 144, 146, 143, 136, 142, 138, 129, 140, 152, 144, 140, 150, 142, 154
Find the range of the given data.
- Calculate the range of the data given below:
| Class | 30 – 40 | 40 – 50 | 50 – 60 | 60 – 70 | 70 – 80 | 80 – 90 | 90 – 100 |
| Frequency | 2 | 3 | 8 | 15 | 12 | 7 | 3 |
For more concepts related to range and measures of dispersion, download BYJU’S – The Learning App today!
Frequently Asked Questions on Range
What does Range mean in statistics?
In statistics, the range is the difference between maximum and minimum values of a data set.
How do you find the range?
We can find the range of different types of data using the specified formulas.
For ungrouped data, range = Highest value of the data set – Lowest value of the data set
For grouped data, range = Upper-class boundary of the highest interval – Lower class boundary of the lowest interval
Is Range always positive?
Yes, the value of a range of any given data set is either zero or a positive number.
What is the range of a list of numbers?
The range of a list of numbers is the difference between the largest and smallest values of that list of numbers.
Can the range be negative?
No, since the range is equal to the difference between highest and lowest numbers, it is always zero or a positive number.

Comments