The Acceleration-Time graph tells us about an object’s velocity the same way the Velocity Time graph tells us about an object’s displacement. In this article, you will learn about acceleration graphs in detail.
|
Table of Contents |
What is Acceleration-Time Graph?
Acceleration-Time Graph shows the acceleration plotted against time for a particle moving in a straight line. The acceleration-time plots acceleration values on the y-axis and time values on the x-axis.
Acceleration-Time Graph Explanation
Vertical Axis
The vertical axis in the acceleration-time graph represents the acceleration of the object. In the given graph below, reading the value of the graph at a particular time will fetch you the acceleration of the object in meters per second squared for that moment.

Slope of the acceleration graph
The slope of the acceleration graph represents a quantity known as a jerk. Jerk is the rate of change of acceleration. In the given acceleration graph as shown below, the slope can be calculated as follows:

Area Under the Acceleration Graph
The area under the acceleration graph represents the change in velocity. In other words, the area under the graph for a certain time interval is equal to the change in velocity during that time interval.
Let us consider the below example to understand better:
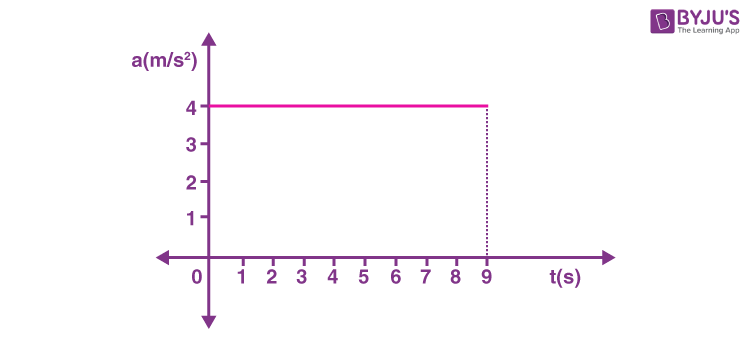
The graph below shows a constant acceleration of 4 m/s2 for a time of 9 s.
Acceleration is defined as,
By multiplying both sides of the equation by the change in time Δt, we get
Substituting the values in the above equation, we get
Multiplying the acceleration by the time interval is equivalent to finding the area under the curve.
The area under the curve is a rectangle. This area can be found by multiplying height and width.
The height, in this case, is 4 m/s2 and the width is 9 s.
The area under any acceleration graph for a certain time interval gives the change in velocity for that time interval.
| Since you are here, you might be interested in the following articles: |
Acceleration Graph Solved Example
A race car driver is cruising at a constant velocity of 20 m/s. As she nears the finish line, the race car driver starts to accelerate. The graph shown below gives the acceleration of the race car as it starts to speed up. Assume the race car had a velocity of 20 m/s at time t=0 s. Find the final velocity of the driver when she reaches the finish line.

Solution:
We can find the change in velocity by finding the area under the acceleration graph.
Substituting the values, we get
This calculation gave us the change in velocity during the given time interval. To calculate the final velocity, we need to use the definition of change in velocity.
Substituting the values in the equation, we get
Therefore, the final velocity of the racer is 44 m/s.
Watch the video and learn the velocity-time graph and displacement-time graph in detail. By the end of this video, you will learn what the slope of the displacement-time graph and velocity-time graph signify.

Frequently Asked Questions – FAQs
What is Acceleration-Time Graph?
What does an Acceleration-Time graph tell us?
What does the area under the acceleration graph represent?
What does the slope of the acceleration time graph tell?
How to graph acceleration-time graph?
Stay tuned to BYJU’S and Fall in Love with Learning!

Put your understanding of this concept to test by answering a few MCQs. Click ‘Start Quiz’ to begin!
Select the correct answer and click on the “Finish” button
Check your score and answers at the end of the quiz
Visit BYJU’S for all Physics related queries and study materials
Your result is as below
Comments