The Lorenz curve was developed by Max O. Lorenz in 1905 to represent inequality in wealth distribution. In other words, it is a graphical representation of the distribution of income or wealth.
Lorenz curve is an important topic in the economics segment of the IAS Exam. Therefore the details from this article will be of immense use for UPSC aspirants. Candidates can download important Indian Economy for UPSC notes from the link.
Aspirants can read Indian Economy-related articles from the links mentioned below:
| Demand and Supply | Kuznets Curve |
| Consumer Price Index (CPI) | Wholesale Price Index (WPI) |
Explanation of Lorenz Curve
The Lorenz curve is represented by a straight diagonal line, which represents perfect equality in income or wealth distribution; the Lorenz curve lies beneath it, showing estimated distribution. The area that is between the straight line and the curved line is the Gini coefficient. The Gini Coefficient itself is expressed as a representation of the scalar measurement of inequality. In the Lorenz Curve, the Gini Coefficient is expressed as the ratio of the area under the straight line
The Lorenz curve is used to represent economic inequality as well as unequal wealth distribution. The farther away the curved line is way from the straight diagonal line, the higher the level of inequality.
Constructing a Lorenz curve involves fitting a continuous function to some incomplete set of data, there is no guarantee that the values along a Lorenz curve (other than those actually observed in the data) correspond to the true distributions of income.
Most of the points along the curve are just guesses based on the shape of the curve that best fits the observed data points. So the shape of the Lorenz curve can be sensitive to the quality and sample size of the data and to the mathematical assumptions and judgments as to what constitutes the best fit curve, and these may represent sources of substantial error between the Lorenz curve and the actual distribution.
Solve previous years’ UPSC Mains Economics Questions by visiting the linked article
For better clarity, the Lorenz curve will be better elaborated upon through the image below:
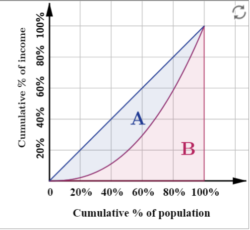
The curve (B) is a graph showing the proportion of overall income or wealth assumed by the bottom x% of the people, although this is not rigorously true for a finite population. It is often used to represent income distribution, where it shows for the bottom x% of households, what percentage, represented by a straight line – A, (y%) of the total income they have. The percentage of households is plotted on the x-axis and the percentage of income is on the y-axis. It can also be used to show the distribution of assets. In such use, many economists consider it to be a measure of social inequality.
Find the strategy and syllabus for UPSC economics in the linked article.
The Gini coefficient is the ratio of the area between the line of perfect equality and the observed Lorenz curve to the area between the line of perfect equality and the line of perfect inequality.
Relevant Question Regarding the Lorenz Curve
What is the Lorenz curve used for?
How is the Lorenz curve interpreted?
How do you plot a Lorenz curve?
Lorenz Curve – UPSC Notes: Download PDF Here
Aspirants can find complete information regarding the UPSC Syllabus through the linked article. More exam-related preparation materials will be found through the links given below
Related Links

Comments