According to the CBSE Syllabus 2023-24, this chapter has been renumbered as Chapter 12.
CBSE Class 9 Maths Statistics Notes
Introduction to Statistics
A study dealing with the collection, presentation and interpretation and analysis of data is called statistics.
Data
- Facts/figures, numerical or otherwise, collected for a definite purpose are called data.
- Data collected first-hand data:- Primary
- Secondary data: Data collected from a source that already had data stored
Frequency
The number of times a particular instance occurs is called frequency in statistics.
Ungrouped data
Ungrouped data is data in its original or raw form. The observations are not classified into groups.
Grouped data
In grouped data, observations are organized in groups.
Class Interval
- The size of the class into which a particular data is divided.
- Eg. divisions on a histogram or bar graph.
- Class width = upper class limit – lower class limit
Regular and Irregular class interval
- Regular class interval: When the class intervals are equal or of the same sizes.
- Eg. 0-10, 10-20, 20-30….. 90-100
- Irregular class interval: When the class intervals are of varying sizes.
- Eg. 0-35, 35-45, 45-55, 55- 80, 80-90, 90-95, 95-100
Frequency table
A frequency table or distribution shows the occurrence of a particular variable in a tabular form.
Sorting
- Raw data needs to be sorted in order to carry out operations.-
- Sorting ⇒ ascending order or descending order
Ungrouped frequency table
When the frequency of each class interval is not arranged or organised in any manner.
Grouped frequency table
The frequencies of the corresponding class intervals are organised or arranged in a particular manner, either ascending or descending.
To know more about Statistics, visit here.
Graphical Representation of Data
Bar graphs
Graphical representation of data using bars of equal width and equal spacing between them (on one axis). The height of the bar represents the frequency of the data.
| Savings (in percentage) | Number of Employees (Frequency) |
| 20 | 105 |
| 30 | 199 |
| 40 | 29 |
| 50 | 73 |
| Total | 400 |
The data can be represented as:

For more information on Bar Graphs And Double Bar Graphs, watch the below videos
To know more about Graphical Representation of Data, visit here.
Variable Being a Number
- A variable can be a number such as ‘no. of students’ or ‘no. of months’.
- Can be represented by bar graphs or histograms depending on the type of data.
Discrete → bar graphs
Continuous → Histograms
Histograms
- Like bar graphs, but for continuous class intervals.
- Area of each rectangle is ∝ Frequency of a variable and the width is equal to the class interval.

For more information on Histogram, watch the below video
To know more about Histogram, visit here.
Frequency polygon
- If the midpoints of each rectangle in a histogram are joined by line segments, the figure formed will be a frequency polygon.
- Can be drawn without histogram. Need midpoints of class intervals.

For more information on Frequency Polygon, watch the below video
To know more about Frequency Polygon, visit here.
Midpoint of class interval
The midpoint of the class interval is called a class mark
Class mark = (Upper limit + Lower limit)/2
Equality of areas
The addition of two class intervals with zero frequency preceding the lowest class and succeeding the highest class intervals equates the area of the frequency polygon to that of the histogram(Using congruent triangles).
Measures of Central Tendency
Average
The average of a number of observations is the sum of the values of all the observations divided by the total number of observations.
Mean

Mode
- The most frequently occurring observation is called the mode.
- The class interval with the highest frequency is the modal class
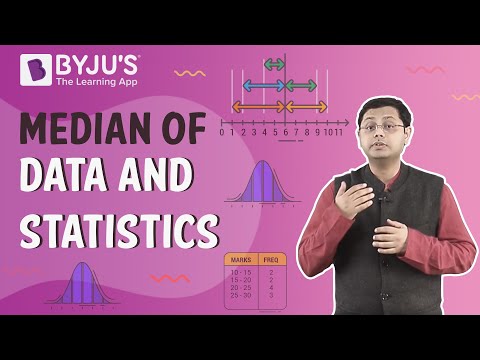
Median
- Value of the middlemost observation.
- If n(number of observations) is odd, Median =[(n+1)/2]th observation.
- If n is even, the Median is the mean or average of (n/2)th and [(n+1)/2]th observation.
For more information on Median, watch the below video
To know more about Measures of Central Tendency, visit here.
Frequently Asked Questions on CBSE Class 9 Maths Notes Chapter 14: Statistics
What is a frequency polygon?
A frequency polygon is a line graph of class frequency plotted against class mid-point.
What is a median?
The median is the middle number in a sorted, ascending or descending, list of numbers.
What are some of the uses of statistics?
Statistics is used in the study and manipulation of data, including ways to gather, review, analyse and draw conclusions from data.
Comments